
- Home >
- Stock Videos >
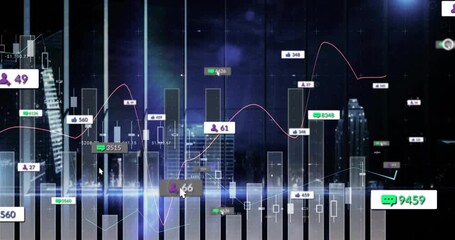
- Transparent Bar Charts and Line Graphs on Digital Dashboard
Transparent Bar Charts and Line Graphs on Digital Dashboard Video
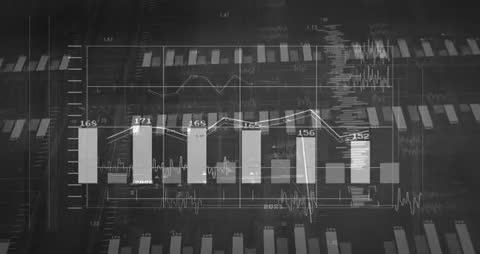
Digital interface showcasing transparent bar charts and line graphs unveils data trends and analytics. Utilized for presentations on technology, business strategies, investments, and scholarly research. Perfect for depicting dynamic numerical insights, data science breakthroughs, or finance tech solutions.
Powered by 


0
downloads
downloads
Tags:
More
Credit Photo
If you would like to credit the Photo, here are some ways you can do so
Text Link
video Link
<span class="text-link">
<span>
<a target="_blank" href=https://pikwizard.com/video/transparent-bar-charts-and-line-graphs-on-digital-dashboard/8fbb9749abc35216541d91902be37142/>PikWizard</a>
</span>
</span>
<span class="image-link">
<span
style="margin: 0 0 20px 0; display: inline-block; vertical-align: middle; width: 100%;"
>
<a
target="_blank"
href="https://pikwizard.com/video/transparent-bar-charts-and-line-graphs-on-digital-dashboard/8fbb9749abc35216541d91902be37142/"
style="text-decoration: none; font-size: 10px; margin: 0;"
>
<video controls style="width: 100%; margin: 0;">
<source src="https://player.vimeo.com/progressive_redirect/playback/1078014998/rendition/240p/file.mp4?loc=external&oauth2_token_id=1223210874&signature=3d8bd1564e6df10a76881069a608d6c5732ac793e1d8e11003ae79260ab56cf7" type="video/mp4"
poster="https://pikwizard.com/pw/medium/8fbb9749abc35216541d91902be37142.jpg"/>
Your browser does not support the video tag.
</video>
<p style="font-size: 12px; margin: 0;">PikWizard</p>
</a>
</span>
</span>
Free (free of charge)
Free for personal and commercial use.
Author: Awesome Content