
- Home >
- Stock Videos >
- Vertical motion graphics of blue upward arrow and colorful trend lines over urban skyline
Vertical motion graphics of blue upward arrow and colorful trend lines over urban skyline Video
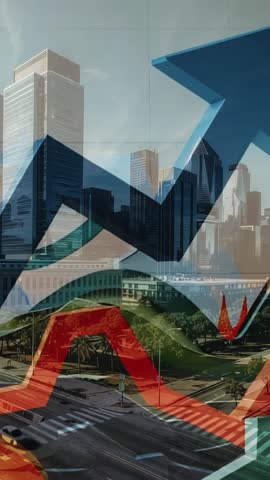
AI Generated Image. Vertical footage showing dark blue arrow ascending above palm-lined crossroad while multicolored trend lines animating across reflective urban skyline. Composition blending real-world cityscape with data-driven overlays, creating strong visual metaphor for finance, market growth, investment momentum and corporate success. High-contrast modern palette featuring deep blues and vibrant reds for immediate attention. Usage suggestions: Suitable for corporate finance presentations, investor pitch decks, social media vertical ads, mobile app intros, news openers and market analysis segments. Pairing with bold sans-serif titles, animated percentage counters and rhythmic electronic soundtrack for energetic pacing. Serving as loop-friendly background for trade show displays, website hero sections and social stories. Technical tips: Maintain 9:16 aspect with safe margins for captions and lower thirds. Matching color grade to brand palette and replacing chart hues for brand consistency. Exporting versions with alpha channel for overlaying on other footage and creating multiple durations (10–30s for social, 45–60s for presentation openers).
Powered by 


0
downloads
downloads
Tags:
More
Credit Photo
If you would like to credit the Photo, here are some ways you can do so
Text Link
video Link
<span class="text-link">
<span>
<a target="_blank" href=https://pikwizard.com/video/vertical-motion-graphics-of-blue-upward-arrow-and-colorful-trend-lines-over-urban-skyline/bf1831788a4b23356affa303e08d942c/>PikWizard</a>
</span>
</span>
<span class="image-link">
<span
style="margin: 0 0 20px 0; display: inline-block; vertical-align: middle; width: 100%;"
>
<a
target="_blank"
href="https://pikwizard.com/video/vertical-motion-graphics-of-blue-upward-arrow-and-colorful-trend-lines-over-urban-skyline/bf1831788a4b23356affa303e08d942c/"
style="text-decoration: none; font-size: 10px; margin: 0;"
>
<video controls style="width: 100%; margin: 0;">
<source src="" type="video/mp4"
poster="https://pikwizard.com/pw/medium/bf1831788a4b23356affa303e08d942c.jpg"/>
Your browser does not support the video tag.
</video>
<p style="font-size: 12px; margin: 0;">PikWizard</p>
</a>
</span>
</span>
Free (free of charge)
Free for personal and commercial use.
Author: AI Creator