
- Home >
- Stock Videos >
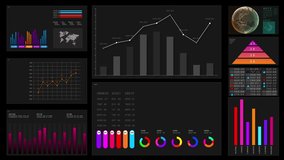
- Vertical video panning across teal bar chart tracking financial trends and performance metrics
Vertical video panning across teal bar chart tracking financial trends and performance metrics Video

AI Generated Video. Panning across teal bar chart, showing rising and fluctuating values with marker pins and connecting line. Featuring vertical 9:16 aspect ratio, close-up framing, shallow depth of field, smooth panning motion. Serving corporate presentations, investor updates, marketing reels, social media ads, explainer videos, financial tutorials, website hero backgrounds, pitch decks. Helping visualize KPI changes, revenue growth, market volatility, campaign performance, and strategic planning. Offering room for on-screen text overlays, data callouts, color grading adjustments, and voiceover narration. Supporting stock libraries, corporate branding, and educational content needing modern financial visuals.
Powered by  - Get 15% off with code: PIKWIZARD15


0
downloads
downloads
Tags:
More
Credit Photo
If you would like to credit the Photo, here are some ways you can do so
Text Link
video Link
<span class="text-link">
<span>
<a target="_blank" href=https://pikwizard.com/video/vertical-video-panning-across-teal-bar-chart-tracking-financial-trends-and-performance-metrics/f871e525d73013f24cb4c0a9fb2aad1b/>PikWizard</a>
</span>
</span>
<span class="image-link">
<span
style="margin: 0 0 20px 0; display: inline-block; vertical-align: middle; width: 100%;"
>
<a
target="_blank"
href="https://pikwizard.com/video/vertical-video-panning-across-teal-bar-chart-tracking-financial-trends-and-performance-metrics/f871e525d73013f24cb4c0a9fb2aad1b/"
style="text-decoration: none; font-size: 10px; margin: 0;"
>
<video controls style="width: 100%; margin: 0;">
<source src="https://player.vimeo.com/progressive_redirect/playback/1145419582/rendition/240p/file.mp4?loc=external&oauth2_token_id=1223210874&signature=3a02267fab405520921c94b5669e86e151a69e55d3986c744560c0b90525a673" type="video/mp4"
poster="https://pikwizard.com/pw/medium/f871e525d73013f24cb4c0a9fb2aad1b.jpg"/>
Your browser does not support the video tag.
</video>
<p style="font-size: 12px; margin: 0;">PikWizard</p>
</a>
</span>
</span>
Free (free of charge)
Free for personal and commercial use.
Author: AI Creator