
- Home >
- Stock Videos >
- Visualization of Declining Stock Market Data with Code Overlay
Visualization of Declining Stock Market Data with Code Overlay Video
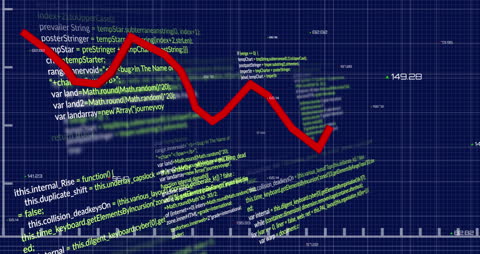
Illustrates a declining stock market graph with computer code overlay. Conveys data analysis, financial loss, or business downturn concepts. Ideal for presentations on financial risks, coding in finance, or tech-based data visualization contexts.
Powered by  - Get 15% off with code: PIKWIZARD15


downloads
Tags:
More
Credit Photo
If you would like to credit the Photo, here are some ways you can do so
Text Link
video Link
<span class="text-link">
<span>
<a target="_blank" href=https://pikwizard.com/video/visualization-of-declining-stock-market-data-with-code-overlay/10fe6e50613c9094d4d5b890078c684e/>PikWizard</a>
</span>
</span>
<span class="image-link">
<span
style="margin: 0 0 20px 0; display: inline-block; vertical-align: middle; width: 100%;"
>
<a
target="_blank"
href="https://pikwizard.com/video/visualization-of-declining-stock-market-data-with-code-overlay/10fe6e50613c9094d4d5b890078c684e/"
style="text-decoration: none; font-size: 10px; margin: 0;"
>
<video controls style="width: 100%; margin: 0;">
<source src="https://player.vimeo.com/progressive_redirect/playback/813356441/rendition/240p/file.mp4?loc=external&oauth2_token_id=1223210874&signature=aac27f81247ee0ad066e738ba31febb0f71b71ac5ae9d1ac2a0e2edc9595a147" type="video/mp4"
poster="https://pikwizard.com/pw/medium/10fe6e50613c9094d4d5b890078c684e.jpg"/>
Your browser does not support the video tag.
</video>
<p style="font-size: 12px; margin: 0;">PikWizard</p>
</a>
</span>
</span>
Free (free of charge)
Free for personal and commercial use.
Author: Awesome Content