
- Home >
- Stock Videos >
- Visualizing Live Market Trends with Rising Bars, Candlestick Signals and Data Icons
Visualizing Live Market Trends with Rising Bars, Candlestick Signals and Data Icons Video
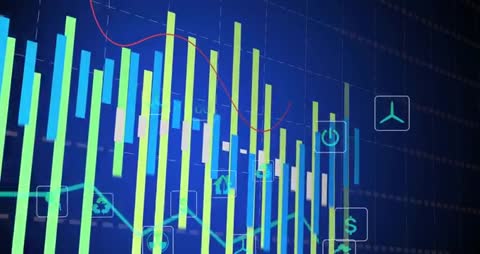
Video showing dynamic financial dashboard visualizing live market trends with rising bar charts, candlestick patterns, moving average lines, and floating icons. Blue grid background creating modern tech aesthetic and strong visual contrast. Serving business presentations, investor reports, fintech apps, trading tutorials, market analysis videos, corporate websites, and social media promos. Offering usage ideas: overlaying voiceover explaining market movements, adding lower-third text for key metrics, using as intro for financial news segments, integrating into pitch decks for investment firms, and applying color grading to match brand palette. File featuring smooth camera motion, zooming timeline, subtle parallax, high-contrast green and cyan bars, red trend line, and icons representing energy, recycling, currency, and power. Suitable for broadcast, web, educational content, and product demos.
Powered by  - Get 15% off with code: PIKWIZARD15


0
downloads
downloads
Tags:
More
Credit Photo
If you would like to credit the Photo, here are some ways you can do so
Text Link
video Link
<span class="text-link">
<span>
<a target="_blank" href=https://pikwizard.com/video/visualizing-live-market-trends-with-rising-bars-candlestick-signals-and-data-icons/a35abca510010d745eebef326b5fa91f/>PikWizard</a>
</span>
</span>
<span class="image-link">
<span
style="margin: 0 0 20px 0; display: inline-block; vertical-align: middle; width: 100%;"
>
<a
target="_blank"
href="https://pikwizard.com/video/visualizing-live-market-trends-with-rising-bars-candlestick-signals-and-data-icons/a35abca510010d745eebef326b5fa91f/"
style="text-decoration: none; font-size: 10px; margin: 0;"
>
<video controls style="width: 100%; margin: 0;">
<source src="https://player.vimeo.com/progressive_redirect/playback/1135556051/rendition/240p/file.mp4%20%28240p%29.mp4?loc=external&oauth2_token_id=1223210874&signature=15498dc433276581f60d0e466118afe454d37bb9621e6f2b009092708ad8c605" type="video/mp4"
poster="https://pikwizard.com/pw/medium/a35abca510010d745eebef326b5fa91f.jpg"/>
Your browser does not support the video tag.
</video>
<p style="font-size: 12px; margin: 0;">PikWizard</p>
</a>
</span>
</span>
Free (free of charge)
Free for personal and commercial use.
Author: Awesome Content