
- Home >
- Stock Videos >
- Wind Turbines and Graph Depicting Fluctuating Power Output
Wind Turbines and Graph Depicting Fluctuating Power Output Video
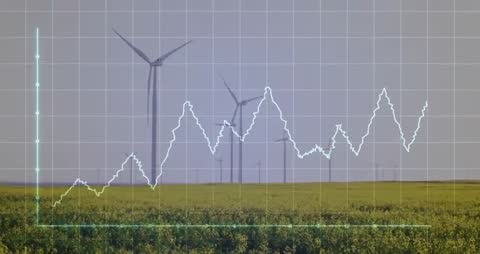
Graphic showing wind turbines interconnected with an overlay of a fluctuating graph. Represents concepts of renewable energy generation, data analytics in power management, clean power technologies, and environmental impact assessment. Suitable for articles on technology-driven renewable energy, increasing efficacy of clean power, and sustainable environmental solutions.
Powered by  - Get 15% off with code: PIKWIZARD15


0
downloads
downloads
Tags:
More
Credit Photo
If you would like to credit the Photo, here are some ways you can do so
Text Link
video Link
<span class="text-link">
<span>
<a target="_blank" href=https://pikwizard.com/video/wind-turbines-and-graph-depicting-fluctuating-power-output/81ecbc0d85c47e6da511ab4849602f0c/>PikWizard</a>
</span>
</span>
<span class="image-link">
<span
style="margin: 0 0 20px 0; display: inline-block; vertical-align: middle; width: 100%;"
>
<a
target="_blank"
href="https://pikwizard.com/video/wind-turbines-and-graph-depicting-fluctuating-power-output/81ecbc0d85c47e6da511ab4849602f0c/"
style="text-decoration: none; font-size: 10px; margin: 0;"
>
<video controls style="width: 100%; margin: 0;">
<source src="https://player.vimeo.com/progressive_redirect/playback/1087869589/rendition/240p/file.mp4?loc=external&oauth2_token_id=1223210874&signature=153f2406d616033ee9fd372fdfc3f413f1797cd7f78e9507286c83810e6ef666" type="video/mp4"
poster="https://pikwizard.com/pw/medium/81ecbc0d85c47e6da511ab4849602f0c.jpg"/>
Your browser does not support the video tag.
</video>
<p style="font-size: 12px; margin: 0;">PikWizard</p>
</a>
</span>
</span>
Free (free of charge)
Free for personal and commercial use.
Author: Awesome Content