
- Home >
- Stock Videos >
- Woman tapping tablet and typing laptop with floating data charts and globe icons
Woman tapping tablet and typing laptop with floating data charts and globe icons Video
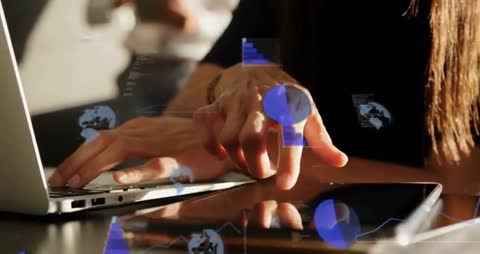
Video clip showing woman tapping tablet and typing laptop while floating data charts and globe icons animate across screens. Closeup composition featuring hands on devices, reflections on tabletop, shallow depth of field, warm natural light. Animated overlays include pie charts, bar graphs, line charts, world map icons and numeric readouts, enhancing sense of real-time analytics and decision making. Footage suiting business and technology storytelling, enabling use in pitch decks, product demos, website headers, social media ads, online courses, corporate training and presentation backgrounds. Editors using clip for lower-third backgrounds, hero sections or overlaying brand graphics and text. Color grading and speed ramping working well for creating dynamic intros, transitions and promotional reels.
Powered by  - Get 15% off with code: PIKWIZARD15


0
downloads
downloads
Tags:
More
Credit Photo
If you would like to credit the Photo, here are some ways you can do so
Text Link
video Link
<span class="text-link">
<span>
<a target="_blank" href=https://pikwizard.com/video/woman-tapping-tablet-and-typing-laptop-with-floating-data-charts-and-globe-icons/1022f0f75922db6b835ca9504ea26429/>PikWizard</a>
</span>
</span>
<span class="image-link">
<span
style="margin: 0 0 20px 0; display: inline-block; vertical-align: middle; width: 100%;"
>
<a
target="_blank"
href="https://pikwizard.com/video/woman-tapping-tablet-and-typing-laptop-with-floating-data-charts-and-globe-icons/1022f0f75922db6b835ca9504ea26429/"
style="text-decoration: none; font-size: 10px; margin: 0;"
>
<video controls style="width: 100%; margin: 0;">
<source src="https://player.vimeo.com/progressive_redirect/playback/1136535108/rendition/240p/file.mp4?loc=external&oauth2_token_id=1223210874&signature=65d43485744cc5cfb30304e6a9ca0e99dad07eac799ecf930c84191822239088" type="video/mp4"
poster="https://pikwizard.com/pw/medium/1022f0f75922db6b835ca9504ea26429.jpg"/>
Your browser does not support the video tag.
</video>
<p style="font-size: 12px; margin: 0;">PikWizard</p>
</a>
</span>
</span>
Free (free of charge)
Free for personal and commercial use.
Author: Awesome Content