
- Home >
- Stock Videos >
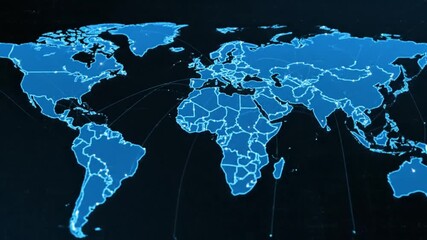
- World Map Animation with Financial Data and Graphs Overlay
World Map Animation with Financial Data and Graphs Overlay Video
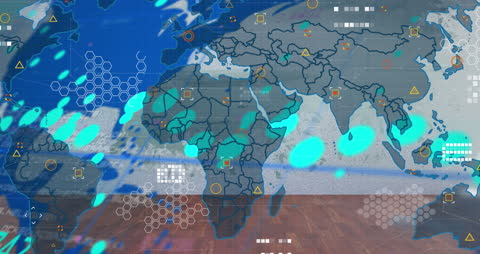
This visually engaging illustration depicts a world map overlaid with animations of financial graphs and data metrics, symbolizing global business transactions and economic analysis. It is ideal for use in infographics, business presentations on international finance, or digital content related to global economic strategies. The abstract presentation emphasizes the dynamic and interconnected nature of global trade and financial systems.
Powered by 


2
downloads
downloads
Tags:
More
Credit Photo
If you would like to credit the Photo, here are some ways you can do so
Text Link
video Link
<span class="text-link">
<span>
<a target="_blank" href=https://pikwizard.com/video/world-map-animation-with-financial-data-and-graphs-overlay/f245b0b7f5e228675633f1070017aafc/>PikWizard</a>
</span>
</span>
<span class="image-link">
<span
style="margin: 0 0 20px 0; display: inline-block; vertical-align: middle; width: 100%;"
>
<a
target="_blank"
href="https://pikwizard.com/video/world-map-animation-with-financial-data-and-graphs-overlay/f245b0b7f5e228675633f1070017aafc/"
style="text-decoration: none; font-size: 10px; margin: 0;"
>
<video controls style="width: 100%; margin: 0;">
<source src="https://player.vimeo.com/progressive_redirect/playback/719891458/rendition/240p/file.mp4?loc=external&oauth2_token_id=1223210874&signature=94b3333859a5fcc26d7f8c376526c96608aefd0eafad76effdf7d99be5e4b1bb" type="video/mp4"
poster="https://pikwizard.com/pw/medium/f245b0b7f5e228675633f1070017aafc.jpg"/>
Your browser does not support the video tag.
</video>
<p style="font-size: 12px; margin: 0;">PikWizard</p>
</a>
</span>
</span>
Free (free of charge)
Free for personal and commercial use.
Author: Awesome Content