
- Home >
- Stock Videos >
- World Map with Global Financial Data Visualization
World Map with Global Financial Data Visualization Video
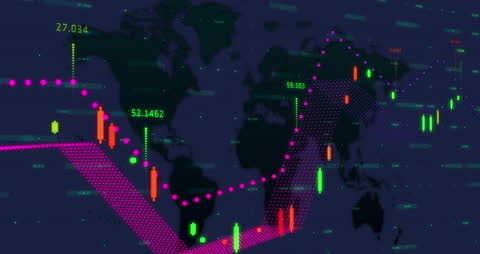
Illustrates dynamic analysis of global financial data using vivid colors and animated charts on a world map background. Useful for articles, presentations, or websites related to global markets, fintech developments, or economic trends.

downloads
Tags:
More
Credit Photo
If you would like to credit the Photo, here are some ways you can do so
Text Link
video Link
<span class="text-link">
<span>
<a target="_blank" href=https://pikwizard.com/video/world-map-with-global-financial-data-visualization/f2368eaba1b11b13eec313180a908416/>PikWizard</a>
</span>
</span>
<span class="image-link">
<span
style="margin: 0 0 20px 0; display: inline-block; vertical-align: middle; width: 100%;"
>
<a
target="_blank"
href="https://pikwizard.com/video/world-map-with-global-financial-data-visualization/f2368eaba1b11b13eec313180a908416/"
style="text-decoration: none; font-size: 10px; margin: 0;"
>
<video controls style="width: 100%; margin: 0;">
<source src="https://player.vimeo.com/progressive_redirect/playback/818270283/rendition/240p/file.mp4?loc=external&oauth2_token_id=1223210874&signature=31045369910b7332bef6f59aea079dd37050afbc86e52900c9b24c25f79836d5" type="video/mp4"
poster="https://pikwizard.com/pw/medium/f2368eaba1b11b13eec313180a908416.jpg"/>
Your browser does not support the video tag.
</video>
<p style="font-size: 12px; margin: 0;">PikWizard</p>
</a>
</span>
</span>
Free (free of charge)
Free for personal and commercial use.
Author: Awesome Content