
Free Digital Chart Insights Images Collection
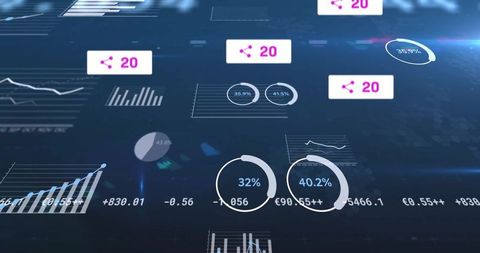
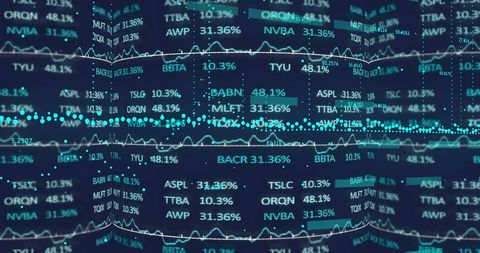
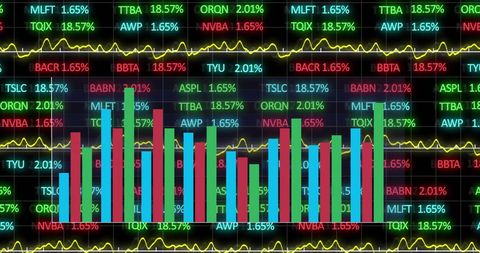
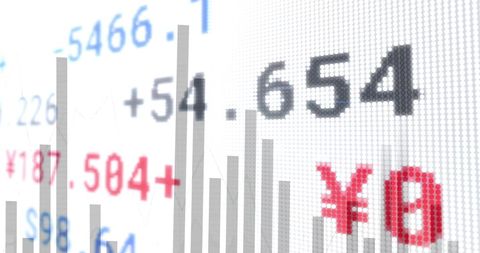
Digital Chart Insights offers a premium stock collection featuring dynamic visual representations that enhance modern digital interfaces. Our collection provides high-quality, abstract asset types ideal for innovative financial data displays and creative analytics. Benefit from expertly curated, global digital assets that empower your projects with precise and forward-thinking visual data insights.
- digital city charts
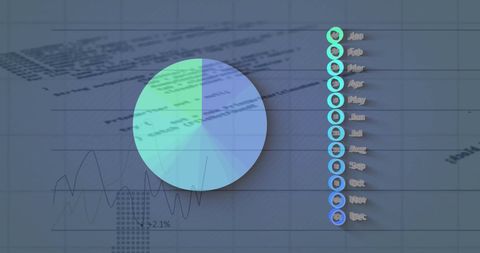
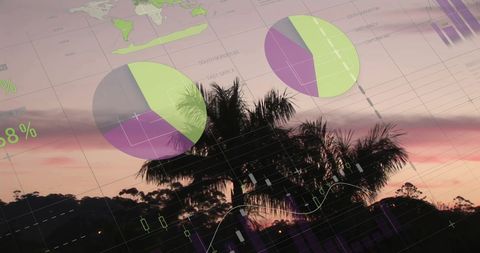
- camembert chart digital
- digital globe matrix
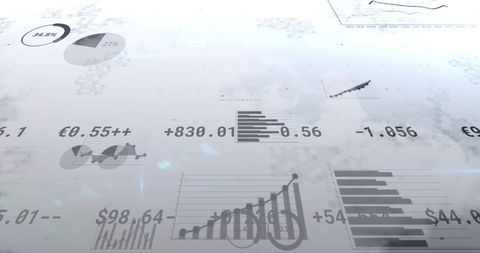
- modern financial insight
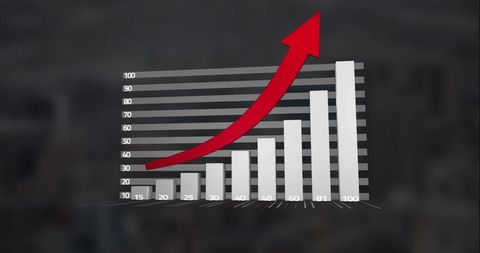
- corporate chart insights
- business digital interface
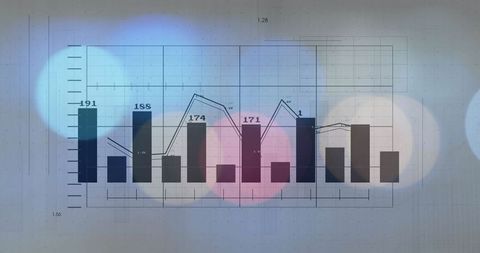
- bar chart on tablet screen
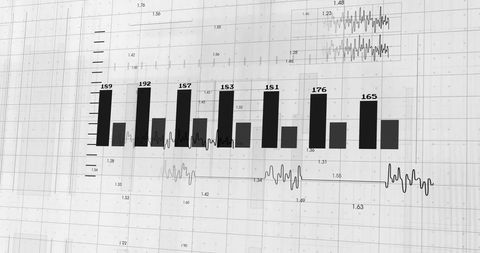
- financial chart metrics
- digital transformation
- digital dashboard
- digital data globe
- digital display
- digital finance node
- digital data processing
- digital visual interface
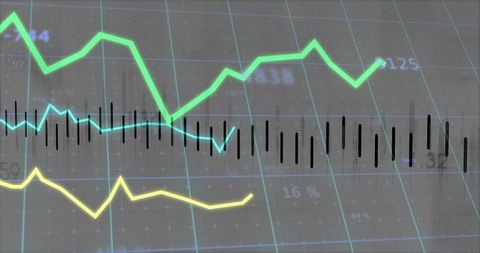
- trading chart
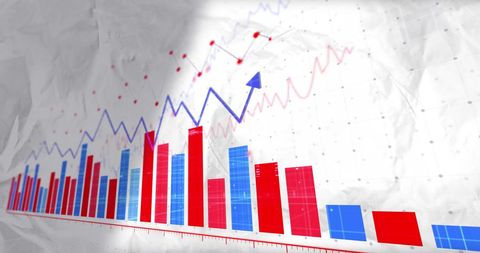
- digital finance graphs


Premium


Premium


Premium

Premium


Premium

Premium


Premium


Premium


Premium


Premium

Premium


Premium


Premium


Premium


Premium

Premium

Premium

Premium


Premium


Premium


Premium


Premium


Premium


Premium


Premium


Premium


Explore More Free Stock Images