Download Financial Chart Metrics Images Collection
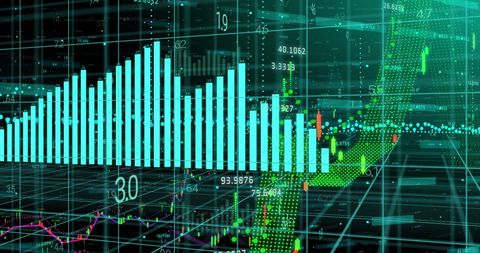
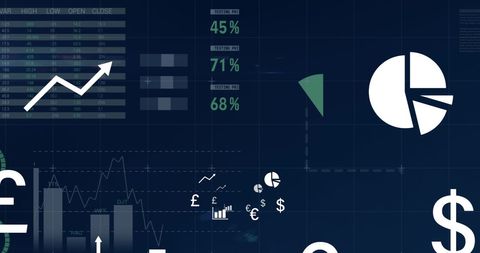
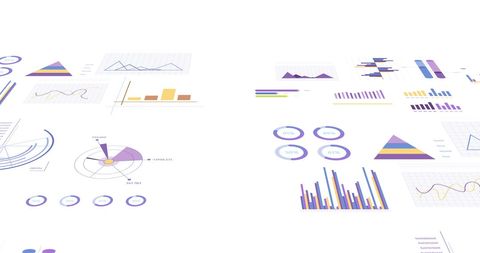
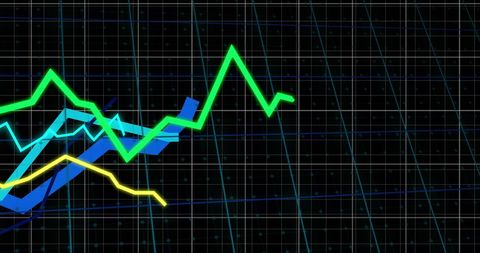
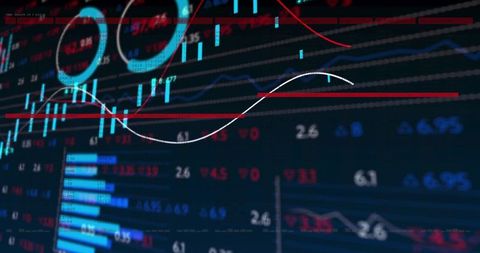
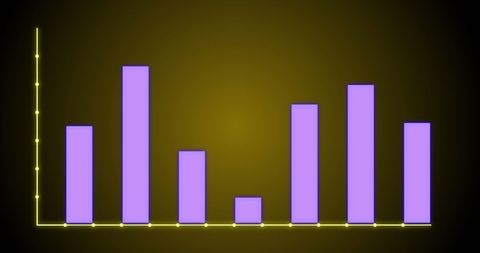
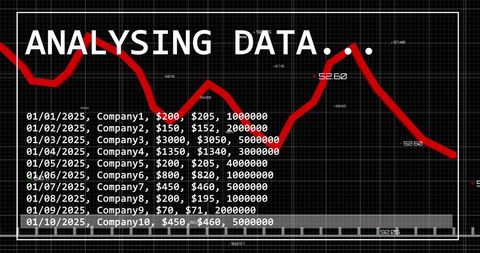
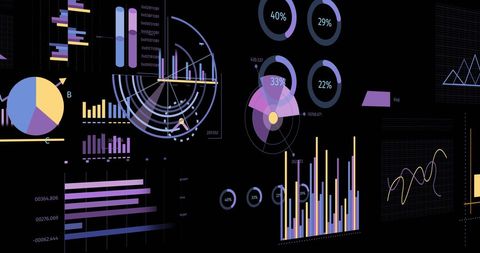
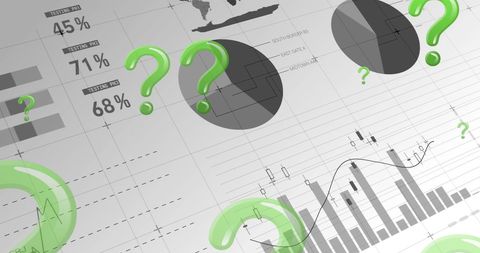
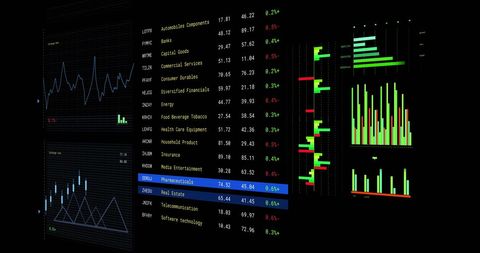
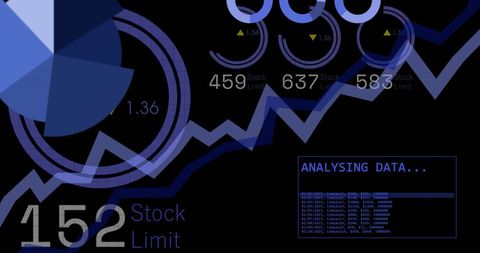
Financial Chart Metrics offers a premium stock collection featuring a dynamic digital visuals assortment that empowers users to interpret global financial trends with clarity. Our curated collection integrates creative asset types and transparent displays that facilitate innovative data analysis and financial insights. Experience a blend of professional imagery and cutting-edge analytics to boost your business strategy and digital transformation efforts.
- financial pulse
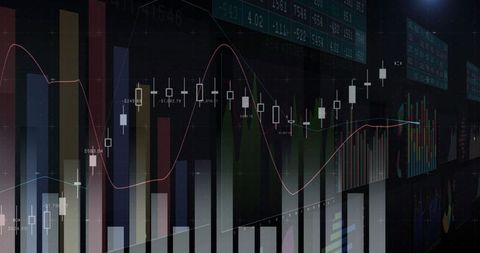
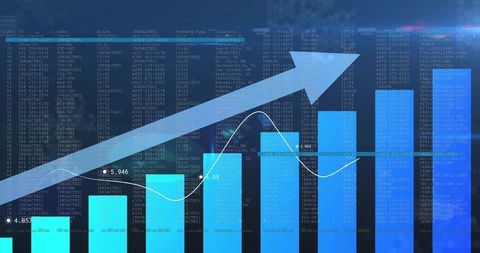
- business finance charts
- financial data alliance
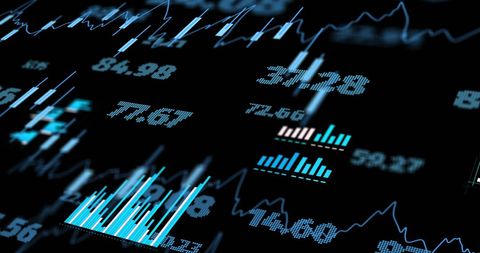
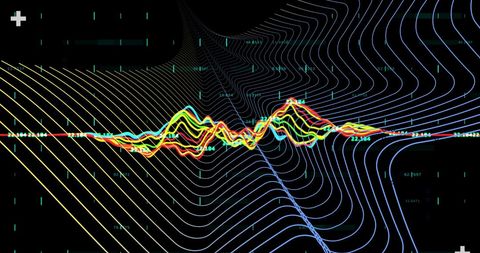
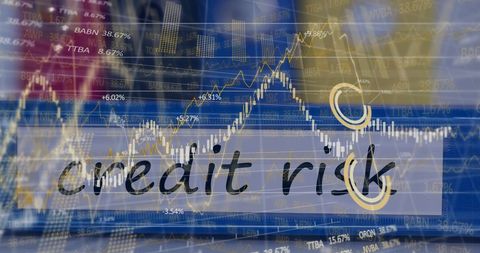
- trading chart
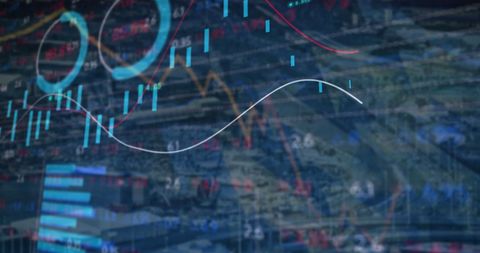
- modern financial insight
- corporate chart insights
- graph network metrics
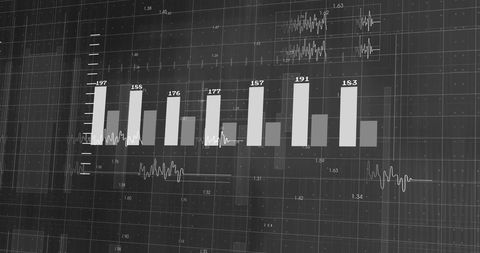
- bar chart on tablet screen
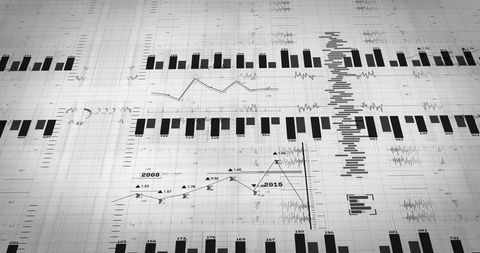
- digital chart insights
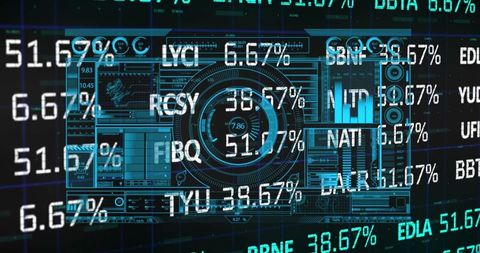
- financial graph interface
- urban financial matrix
- financial city metrics
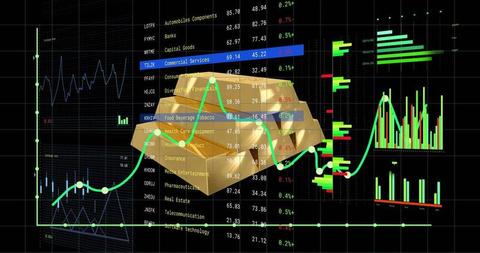
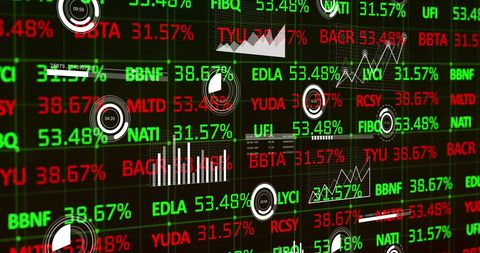
- global market charts
- digital market network
- financial intelligence