Displays a concept of data visualization representing stock market analytics, including yellow bar graphs and a white line graph on a purple backdrop. Stock tickers enhance visual representation of a dynamic and engaging financial display. Useful for depicting financial services, technology in finance, data trends, or digital investment strategies in presentations, publications, or educational materials.
  1. Home > 
  2. Most Popular Photos  >  
  3. Graph

Free Graph Images

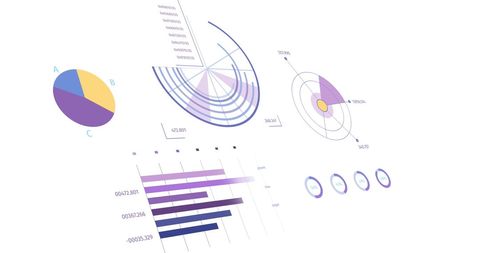
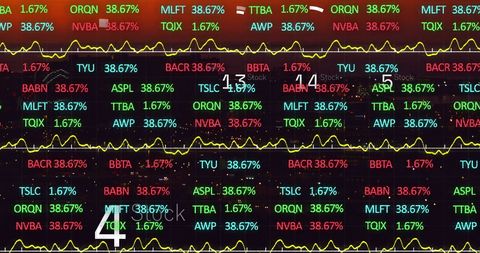
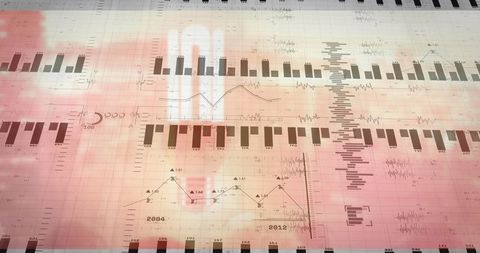
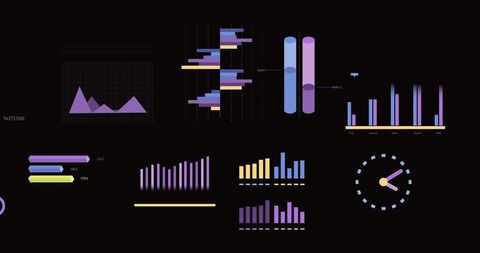
Explore our collection of free graph images, featuring bar charts, line graphs, pie charts, histograms, and modern data visualizations. Each image is available in high resolution, perfect for business presentations, reports, educational content, infographics, and creative projects. Our royalty-free graph photos include colorful, clear, and professionally designed charts that help communicate information effectively. Whether you’re illustrating statistics, creating analytics reports, or designing educational materials, our graph images provide high-quality, visually appealing visuals for every project.

Premium
Premium
Premium
Stock Market Data Visualization With Bar and Line Graphs
Global Financial Analytics: Green Line Graph on Digital Globe
Futuristic Data Visualization Dashboard with Bar and Line Graphs
Holographic Data Interface with Graphs and Maps
Businesswoman Analyzing Data with Digital Graphs Interface
Futuristic Dashboard with 3D Bar Graph and Icons Represents Analytics
Declining Stock Market Graph on Dotted Grid Background
Abstract Financial Graphs and Statistics on White Background
Financial Analytics Display with Digital Graphs and Charts
Dynamic Data Analytics with Digital Graph Insights
Global Data Visualization with Interactive Graphs and Network Nodes
Green Bar Graph and Rising Line Graph Depicting Data Analysis
Businessman Analyzing Financial Graphs and Calculator
Colorful Bar Graphs Showing Data Analysis Trends
Premium
Dynamic 3D Forex Line Graph on Digital Grid Display
Futuristic Trading Dashboard with Neon Graphs and Data Visualization
Rising Financial Graph with Digital Data Interface
Abstract Financial Graphs with Pie Chart over Data Grid
Premium
Stock Market Data Display with Digital Tickers and Line Graphs
Premium
Premium
Neon Graphs on Futuristic Digital Dashboard Interface
Premium
Belarus Data Analytics Dashboard with Financial Graphs
Digital Graphs on Blue Background Illustrating Financial Data
Futuristic Finance and Technology Concept with Graphs
Futuristic Dashboard with Graphs Over Nanotechnology Circuit
Businessman Tracking Financial Graphs on Smartphone in Modern Office
Chained Dollar Sign on Downward Economic Graph
Medical Team Analyzing Healthcare Data with Declining Graph
Premium
Dynamic Graphs Showing Stock Market Trends
Digital Financial Graph Representing Market Trends
AI
Multicolor 3D Arrow Graph Depicting Steady Growth
Financial Graphs Overlay with Oil Refinery Pump
Premium
Abstract Financial Graphs Displaying Market Trends
Digital Graphs Displaying Financial Growth
Abstract Financial Graph Analysis Global Currencies Overlay
Colorful Stock Market Graph with LED Display Style
Graph Overlay on Urban Cityscape Indicating Economic Trends
Digital Financial Analysis with 3D Graphs
Audio Engineer Adjusting Console with Data Graph Overlay
Futuristic Digital Dashboard with Fluctuating Data Graph and Code
Dynamic Stock Market Ticker Display with Graphs
Dynamic Stock Market Graphs on Trading Board Background
Dynamic Data Dashboard with Graphs and Analytics Visualizations
Dynamic Data Graph with Futuristic Technology Background
Dynamic 3D Graph Analytics with Red and Blue Bars
Digital Analysis with Line Graph and Business Icons
Financial Trading Dashboard with Bar and Line Graphs
Financial Graph Overlay with Urban Cityscape View
Premium
Neon Data Graph over JavaScript Code Interface
Premium
Premium
Digital Graph Overlays in Ocean Sunrise Environment for Data Visualization
Abstract Digital Graph with Data Visualization
Premium
Pie Graph and Red Line Graph with Financial Data
Dynamic Digital Dashboard with Graphs and Analytics
Innovative Team Analyzing Business Growth with Digital Graphs
Premium
Bar Graph with Financial Data Overlaying Cloud Background
Innovative Data Visualization with Digital Line Graphs Interface
Financial Graphs and Global Data Dynamics Overlay
3D Financial Charts and Graphs on White Background
Maritime Financial Data Visualization Concept with Line Graphs and Sea
Digital Dashboard with Data Analysis Charts and Graphs
Digital Financial Analytics Display with Graphs and Currencies
Digital Green Bar Graph Over Dark Background Illustrating Market Trends
Colorful Financial Graphs and Analytics on Black Background
Woman Analyzing Data with Digital Graph Interface
Premium
Doctor Analyzing Financial Graph in Modern Medical Facility
Businesswoman Using Cellphone with Overlay of Falling Graphs
Financial Data Analysis with Stock Market Graphs
Digital Financial Trading Dashboard with Candlestick and Bar Graphs
Innovative Digital Graphs on Navy Background Depicting Financial Growth
Premium
Financial Graph Overlay with Cityscape Background
Premium
Digital Data Visualization Charts and Graphs on Purple Background
Innovation Growth Concept with Line Graph on Chalkboard
Diverse Colleagues Analyzing Graph Report in Office Corridor
Woman Working with Digital Graphs Overlay Reflecting Loss
Premium
Explore More Free Stock Images