Six digital panels with graphs and data graphics combine with circuit patterns on dark backdrop. Ideal for business presentations, digital media related to technology solutions. Useful for illustrating articles or infographics on finance, computational advancements.
  1. Home > 
  2. Most Popular Photos  >  
  3. Graph Network Metrics

Free Graph Network Metrics Images Collection

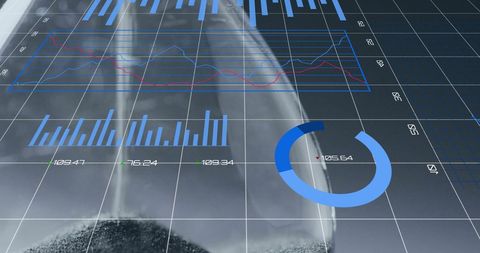
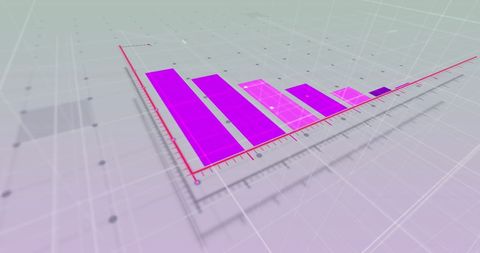
Graph Network Metrics elevates your creative projects with a premium stock collection of dynamic visual assets. Our collection features a versatile photos display and interactive digital interfaces that capture futuristic data analytics and complex network designs. Experience high-quality craftsmanship, innovative design, and comprehensive assets tailored for modern digital media projects.

Loading...
Premium
A collection of digital coins surrounded by bar graphs in blue light, showcasing the latest trends in cryptocurrency data analysis
Premium
Collection of blue data visualization icons
Premium
Collection of flat design icons representing data analysis business growth and scientific research
Premium
Futuristic Data Visualization Interface with Neon Elements, Featuring Colorful Graphs, Charts, and Informative Panels for Modern Technology Analysis
Premium
Real-Time AI-Driven Dashboard for Data Analysis
Premium
Hand touching digital graph data interface, representing data analysis, technology, and futuristic business intelligence.
Premium
Digital dashboard with colorful graphs and data visualization elements
Premium
Futuristic Data Visualization and Interface Design
Premium
A collection of graphs and analytics data visualizing social media activity over time, presenting key insights and trends. Generative AI
Premium
Augmented reality glasses reflecting audit data, quality charts, and holographic displays in a high-tech lab, Sci-fi, Futuristic, Blue hues.
Premium
Digital Data Visualization with Graphs and Charts on Tablet Screen
Premium
Colorful business chart and graph icon set isolated on white background, representing data analysis and sales performance metrics
Premium
Close-up of a hand using a keyboard while analyzing data on a computer screen with colorful graphs and statistics.
Premium
Featuring multiple large screens, this high-tech room displays intricate data visualizations, including global maps, graphs, and statistics, emphasizing advanced analytics in a corporate setting
Premium
A collection of six different black and white data and chart related line art icons in a grid layout created with generated ai
Premium
Futuristic Data Visualization Design with Colorful Graphs and Digital Charts Representing Financial Trends and Business Analytics in a High-Tech Environment
Premium
Collection of business and technology icons representing global synchronization and performance.
Premium
digital tablet displaying advanced data analytics and graphs on a futuristic interface.
Premium
Modern laptop displaying financial data graphs and charts in a cozy workspace with sunlight streaming through plants, ideal for business and finance themes.
Premium
Using a digital tablet to analyze data and visualize information in a high-tech environment with screens displaying various metrics
Premium
Create a dynamic collection of cutting-edge business graphics showcasing innovation, technology, and digital transformation
Premium
Engaging Graphic Depicting Real-Time Data Analysis With Futuristic User Interface and Analytical Metrics. Asymptotic smart data analytic.
Premium
A collection of wooden figurines represents teamwork and collaboration, set against a backdrop of charts and graphs, symbolizing business dynamics.