- Home >
- Stock Photos >
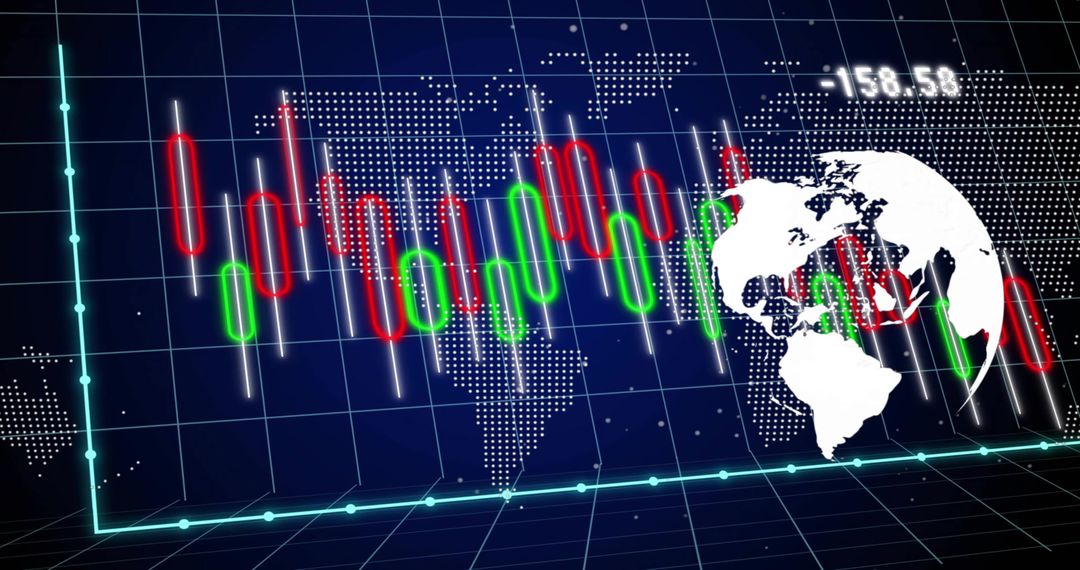
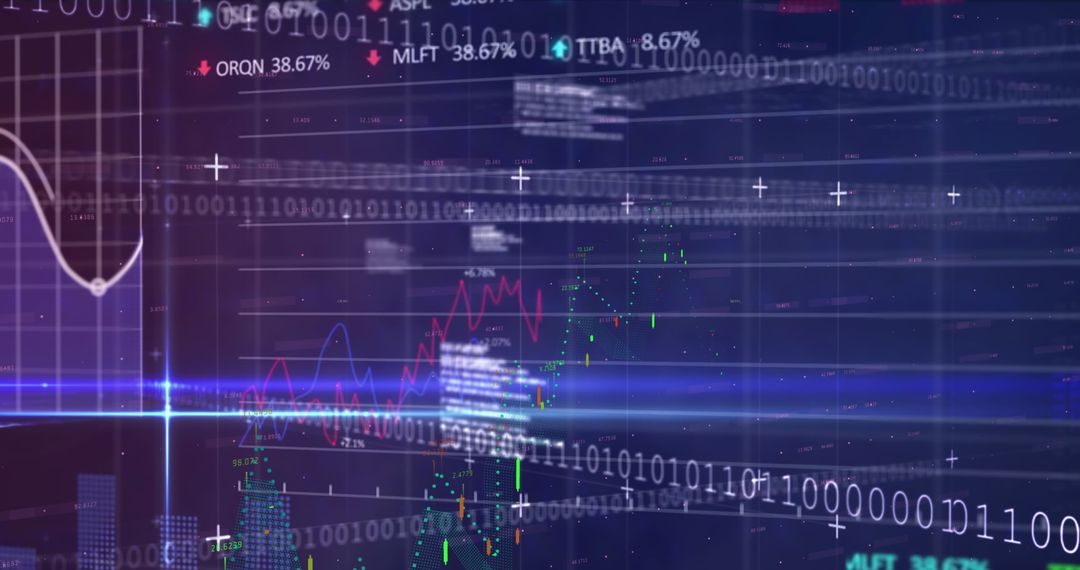
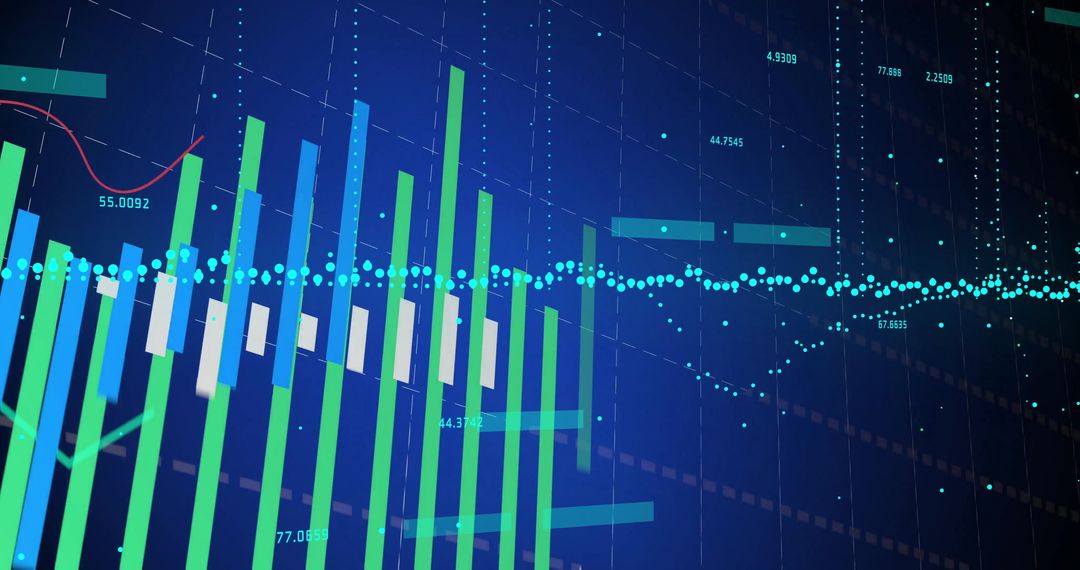
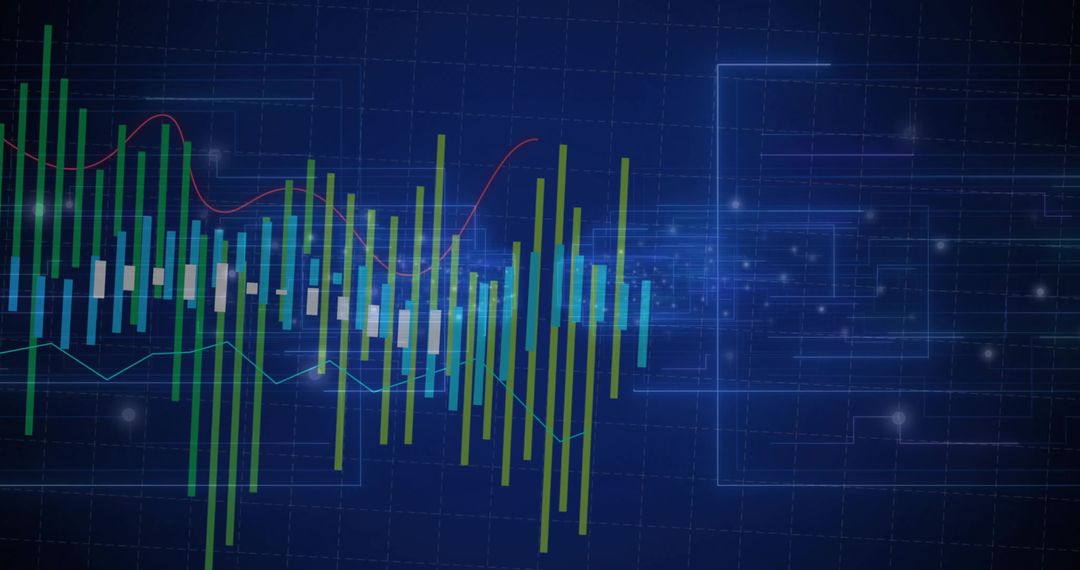
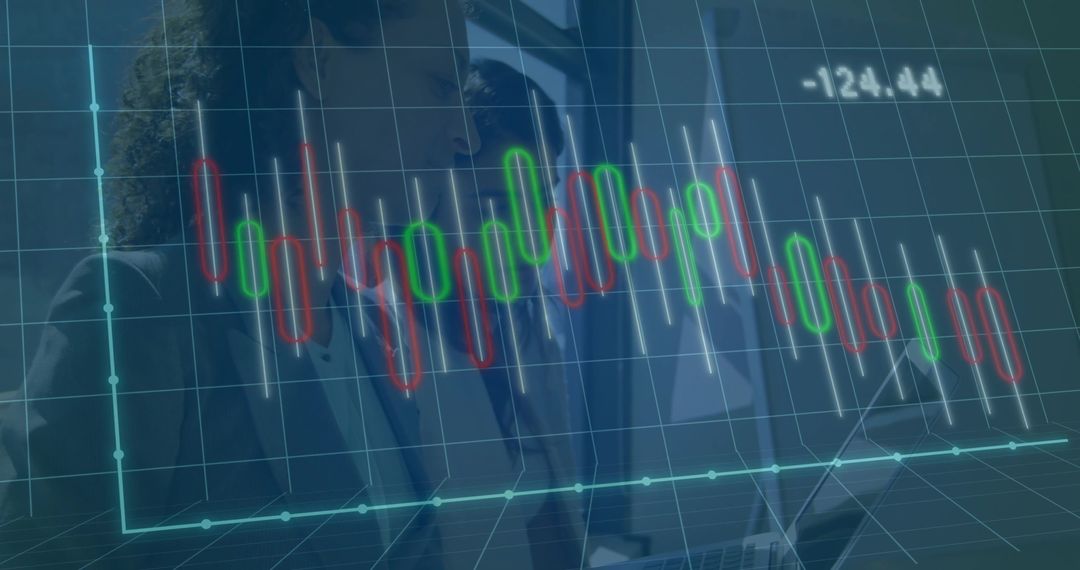
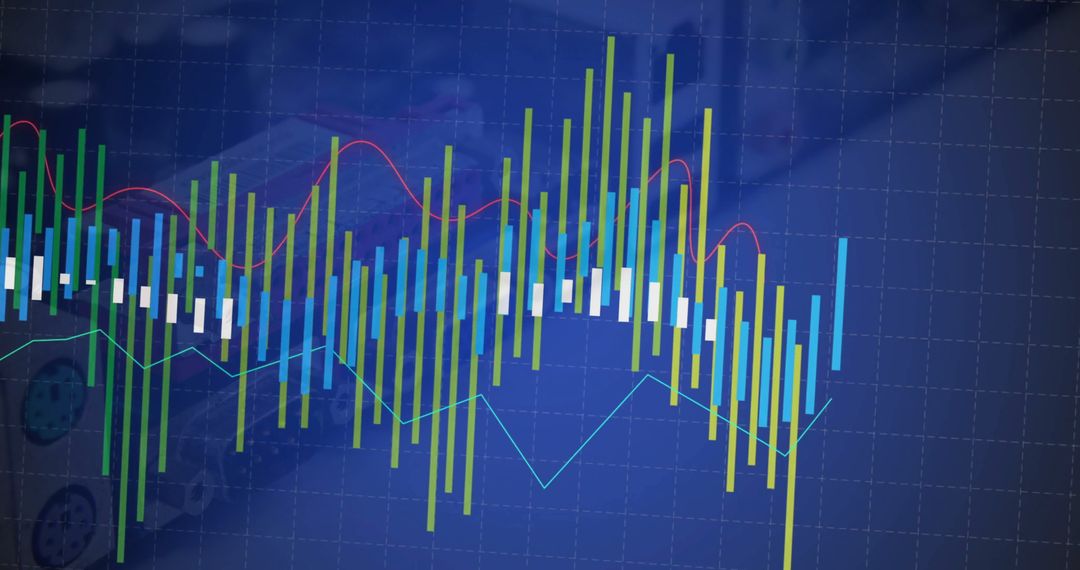
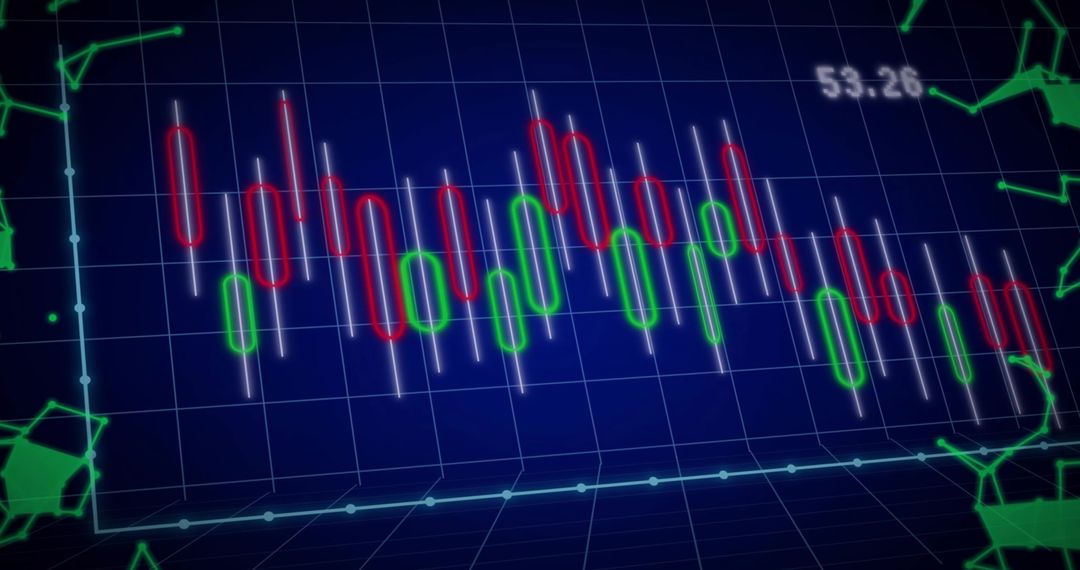
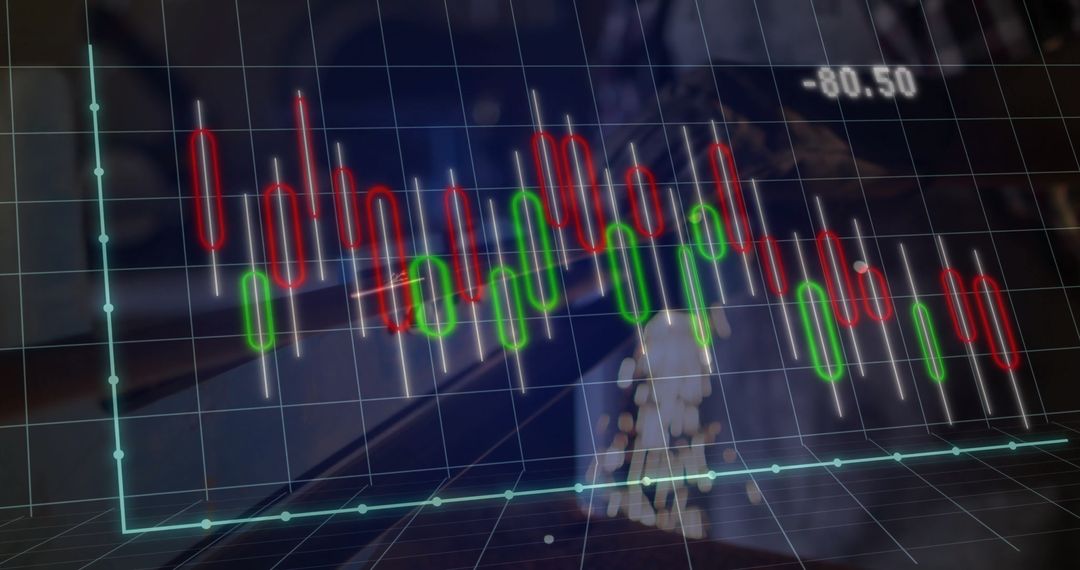
- 3D Candlestick Chart Display on Financial Trading Interface
3D Candlestick Chart Display on Financial Trading Interface Image
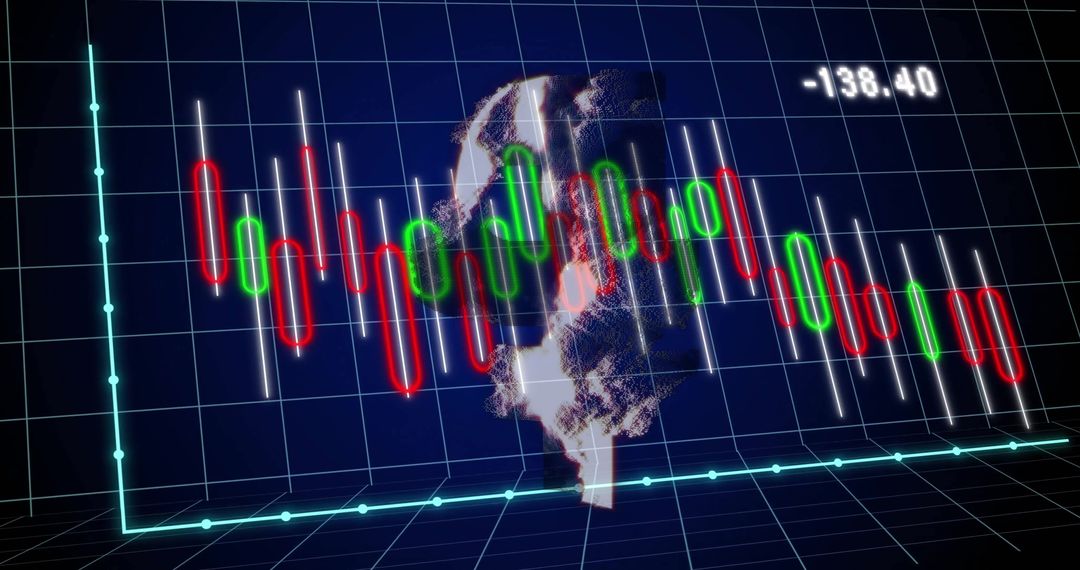
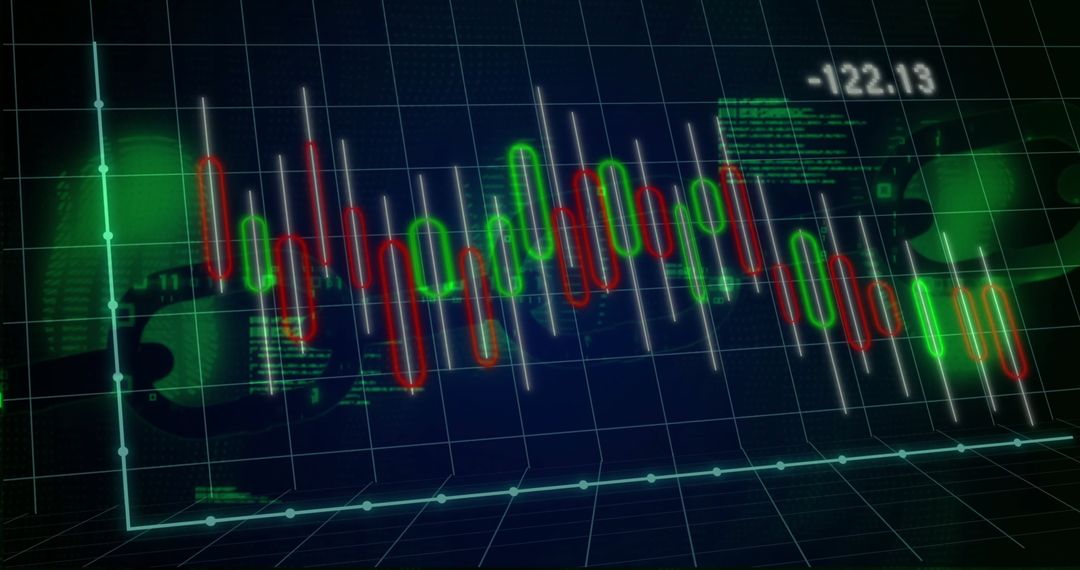
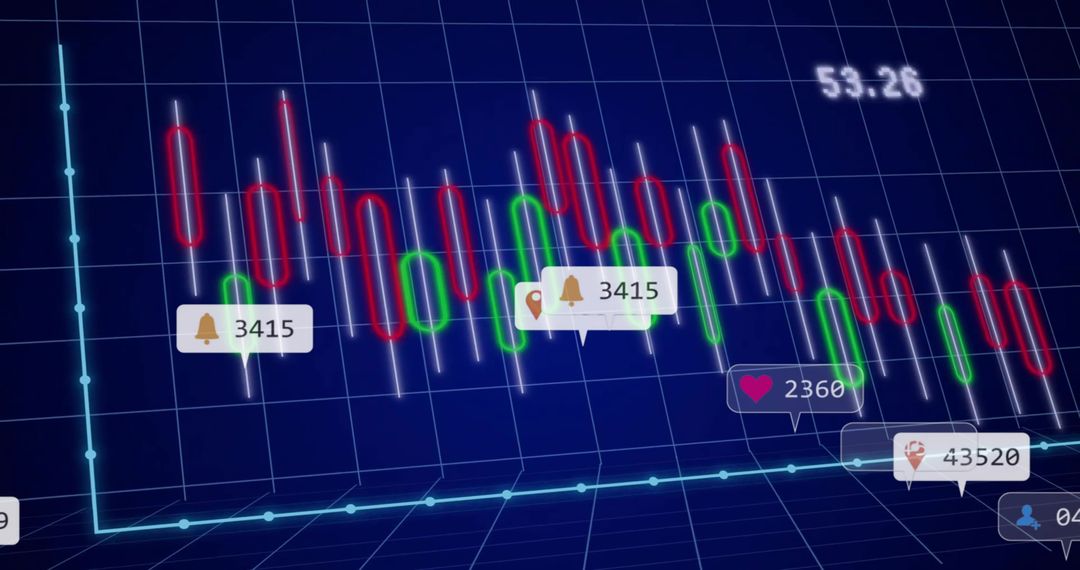
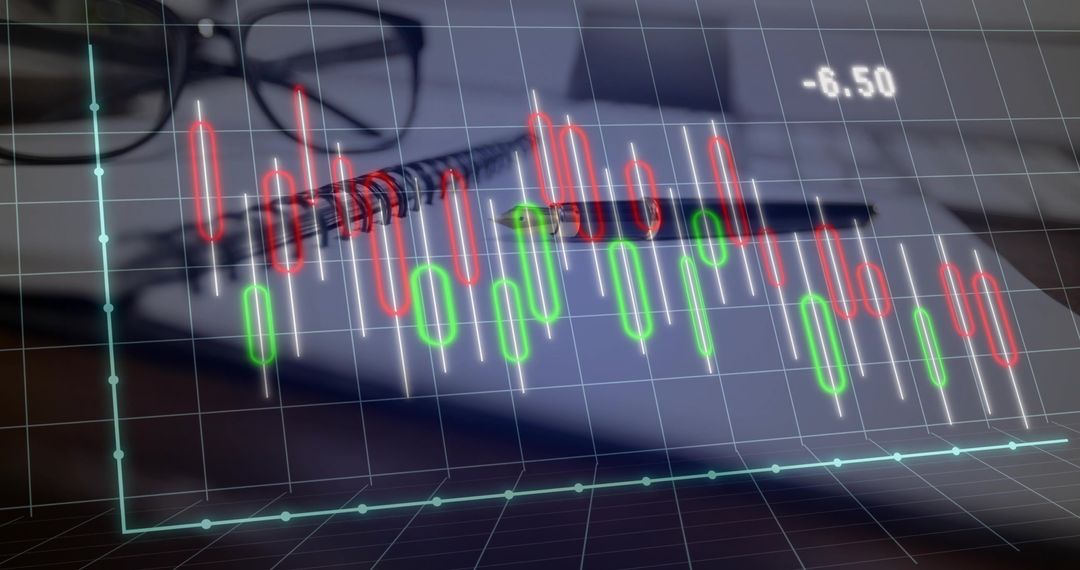
Dynamic 3D representation of a candlestick chart showcasing real-time market trends in green and red colors, with white wicks indicating high and low prices. Designed for finance professionals, traders, and analysts, illustrating the intricacies of the financial market with detailed visualization. Perfect for articles on financial trends, finance software reads, or educational materials about trading and technical analysis.
Powered by  - Get 15% off with code: PIKWIZARD15


0
downloads
downloads
Tags:
More
Credit Photo
If you would like to credit the Photo, here are some ways you can do so
Text Link
photo Link
<span class="text-link">
<span>
<a target="_blank" href=https://pikwizard.com/photo/3d-candlestick-chart-display-on-financial-trading-interface/e3ca2c45a62d580558119cd6a4b14f83/>PikWizard</a>
</span>
</span>
<span class="image-link">
<span
style="margin: 0 0 20px 0; display: inline-block; vertical-align: middle; width: 100%;"
>
<a
target="_blank"
href="https://pikwizard.com/photo/3d-candlestick-chart-display-on-financial-trading-interface/e3ca2c45a62d580558119cd6a4b14f83/"
style="text-decoration: none; font-size: 10px; margin: 0;"
>
<img src="https://pikwizard.com/pw/medium/e3ca2c45a62d580558119cd6a4b14f83.jpg" style="margin: 0; width: 100%;" alt="" />
<p style="font-size: 12px; margin: 0;">PikWizard</p>
</a>
</span>
</span>
Free (free of charge)
Free for personal and commercial use.
Author: People Creations
Similar Free Stock Images
Premium


Premium


Premium


Premium


Premium


Premium


Premium


Premium


Premium


Premium


Premium


Premium


Premium


Premium


Premium


Premium


Premium


Premium


Premium


Premium


Premium


Premium


Premium


Premium