- Home >
- Stock Photos >
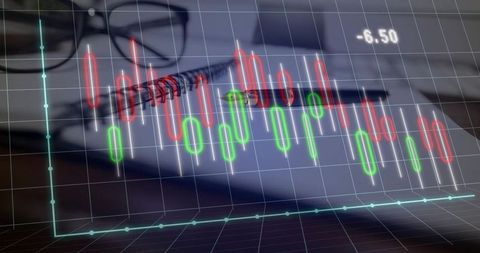
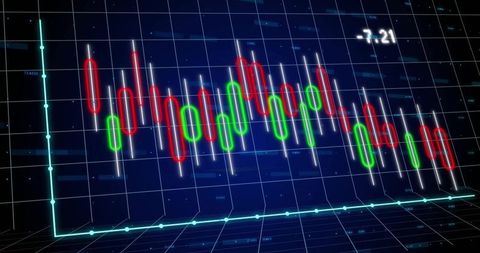
- 3D Candlestick Chart with Falling Stock Value
3D Candlestick Chart with Falling Stock Value Image
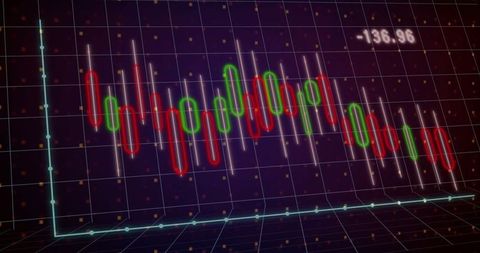
Digital render depicts a financial candlestick chart showing fluctuating stock values. Ideal for demonstrating market trends, economic insights, financial analysis, and investment strategies. Useful for presentations and articles on stock trading and data science.

downloads
Tags:
More
Credit Photo
If you would like to credit the Photo, here are some ways you can do so
Text Link
photo Link
<span class="text-link">
<span>
<a target="_blank" href=https://pikwizard.com/photo/3d-candlestick-chart-with-falling-stock-value/b2b8fc75115d22299439f12ba26e1530/>PikWizard</a>
</span>
</span>
<span class="image-link">
<span
style="margin: 0 0 20px 0; display: inline-block; vertical-align: middle; width: 100%;"
>
<a
target="_blank"
href="https://pikwizard.com/photo/3d-candlestick-chart-with-falling-stock-value/b2b8fc75115d22299439f12ba26e1530/"
style="text-decoration: none; font-size: 10px; margin: 0;"
>
<img src="https://pikwizard.com/pw/medium/b2b8fc75115d22299439f12ba26e1530.jpg" style="margin: 0; width: 100%;" alt="" />
<p style="font-size: 12px; margin: 0;">PikWizard</p>
</a>
</span>
</span>
Free (free of charge)
Free for personal and commercial use.
Author: Awesome Content