
- Home >
- Free Stock Photos & Images >
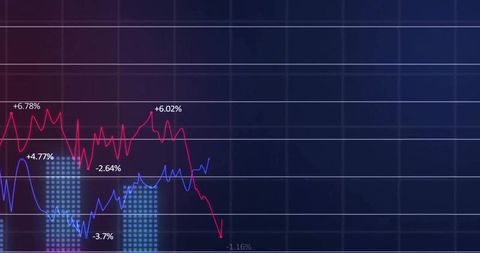
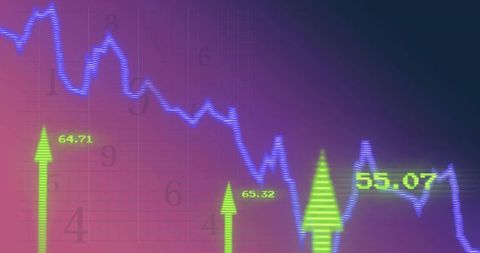
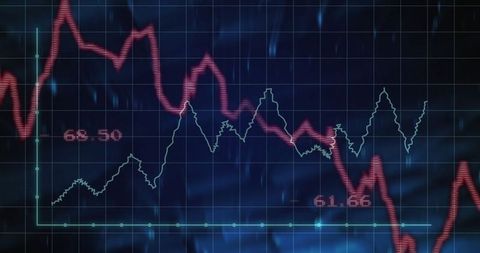
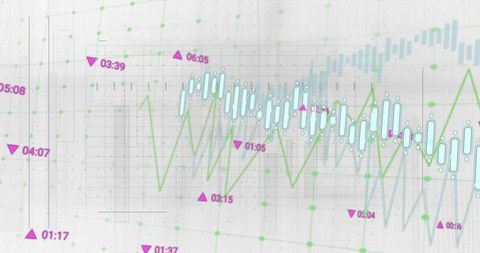
- 3D Wireframe NFT Hovering Over Crypto Trading Dashboard With Candlestick Chart Analytics
3D Wireframe NFT Hovering Over Crypto Trading Dashboard With Candlestick Chart Analytics Free Stock Image

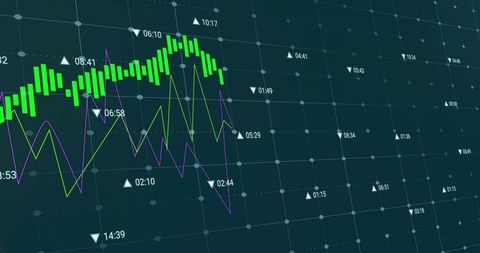
Showcasing 3D wireframe NFT hovering over neon trading dashboard with green and red candlesticks and blue volume peaks. Featuring holographic glow, grid lines, subtle data overlays, and depth perspective conveying market movement and volatility. Serving NFT marketplace hero banners, crypto trading platform UI mockups, fintech presentations, blog posts about NFT market trends, market analysis reports, conference materials, social media ads, and video intros. Working well as background for headlines, thumbnails, editorial commentary, app splash screens, and webinar slides. Highlighting neon blue, electric green, red accents, and golden wireframe to create futuristic, high-tech mood. Leaving ample center space for title or call-to-action and lower area for logo placement. Recommending use of bold white or neon text for contrast and exporting at high resolution for print or digital use.
Powered by  - Get 15% off with code: PIKWIZARD15


downloads
Tags:
More
Credit Photo
If you would like to credit the Photo, here are some ways you can do so
Text Link
photo Link
<span class="text-link">
<span>
<a target="_blank" href=https://pikwizard.com/photo/3d-wireframe-nft-hovering-over-crypto-trading-dashboard-with-candlestick-chart-analytics/284ec8f74ac58b6b1163e15b073c668b/>PikWizard</a>
</span>
</span>
<span class="image-link">
<span
style="margin: 0 0 20px 0; display: inline-block; vertical-align: middle; width: 100%;"
>
<a
target="_blank"
href="https://pikwizard.com/photo/3d-wireframe-nft-hovering-over-crypto-trading-dashboard-with-candlestick-chart-analytics/284ec8f74ac58b6b1163e15b073c668b/"
style="text-decoration: none; font-size: 10px; margin: 0;"
>
<img src="https://thumbs.wbm.im/pw/medium/284ec8f74ac58b6b1163e15b073c668b.jpg" style="margin: 0; width: 100%;" alt="3D Wireframe NFT Hovering Over Crypto Trading Dashboard With Candlestick Chart Analytics" />
<p style="font-size: 12px; margin: 0;">PikWizard</p>
</a>
</span>
</span>
Free (free of charge)
Free for personal and commercial use.
Author: Authentic Images
Similar Free Stock Images


Premium


Premium


Premium


AI


Premium


Premium


Premium


Premium


Premium


Premium


Premium


Premium


Premium


Premium


Premium

AI


Premium


Premium


Premium


Premium


Premium


Premium


Premium


Premium


Premium


Premium


Premium
Explore More Free Stock Images