1. Home > 
  2. Free Stock Photos & Images > 
  3. Abstract Dashboard with Flow Panel and Data Visualization

Abstract Dashboard with Flow Panel and Data Visualization Free Stock Image

Abstract Dashboard with Flow Panel and Data Visualization

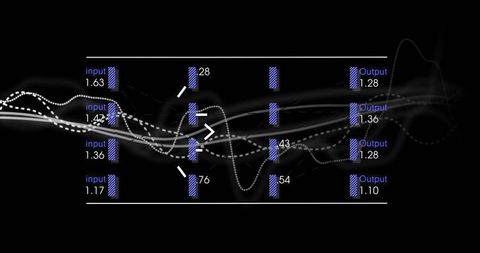
This abstract visual displays a dashboard flow panel with data visualization elements, including blue bars, numeric labels, and waveform lines. Ideal for presentations and infographics related to technology, digital interfaces, and data analysis projects.

Powered by Shutterstock logo - Get 15% off with code: PIKWIZARD15
Abstract enterprise dashboard user interface with sidebar menu and productivity summary cards. Ideal for illustrating software UI, smart business tools, and digital workplace systems. - Powered by Shutterstock - Get 15% off with code: PIKWIZARD15Flowing magenta stream and translucent panel displaying COLLECTING DATA... on HUD with %21.09. Neon, interface, dashboard, grid, matrix, glow, analytics - Powered by Shutterstock - Get 15% off with code: PIKWIZARD15Displaying hexagonal icon nodes flowing data with glowing lines over grid on display, copy space. Technology, cybersecurity, data analytics, innovation, digital, visualization, abstract - Powered by Shutterstock - Get 15% off with code: PIKWIZARD15Glossy red panel is showing white user-icon network in 3D render with reflective grid. Interface, dashboard, graph, connectivity, neon, crimson, depth - Powered by Shutterstock - Get 15% off with code: PIKWIZARD15Flowing red waves displaying translucent HUD panels and numeric readouts in digital visualization. Futuristic, holographic, data, analytics, finance, neon, abstract - Powered by Shutterstock - Get 15% off with code: PIKWIZARD15

Credit Photo

If you would like to credit the Photo, here are some ways you can do so

Free (free of charge)

Free for personal and commercial use.

Author: Authentic Images

Similar Free Stock Images

Digital Data Processing with Abstract Financial Graph on Green Background
Displaying Neon Waveform Analytics HUD Showing Colorful Oscillating Data Lines
Graph Showing Stock Market Activity and Financial Data Analysis
Digital Interface with DNA Strand and Biometric Data
Premium
Digital Data Analysis on Futuristic Black Background
Futuristic Data Visualization with Highlighted Analytics Trends
Dynamic Data Visualisation with Futuristic Digital Display
Digital Data Analysis with Stock Market Visualization
Premium
Dynamic Multicolored Waveforms in Digital Data Visualization
Global Financial Data Visualization and Analysis
Financial Data Chart Over City Silhouette
Digital Financial Data Analysis with Global Technological Interface
Premium
Data Analysis and Coding Overlay with Graphs and Financial Symbols
Abstract Digital Waveform in Data Processing Visualization
Abstract Financial Data Visualization on Dark Digital Grid
Futuristic Financial Graph with Candlesticks and Wave Line
Premium
Dynamic Digital Dashboard with Analytics and Heart Count Interaction
Digital Interface with Overlapping Code and Graph
Futuristic Data Panel Displaying White Telemetry Dashboard with Waveform and Bar Graph
Futuristic Technology Interface with DNA Elements
Premium
Futuristic Data Visualization with Colorful Waveforms on Digital Interface
Colorful Financial Data Visualization on Dark Grid
Abstract Financial Data Streaming Over World Map Visualization
Financial Data Processing Terminal With Global Connections
Premium
Green Line Graph Overlaid on Empty Office with Data Overlay
Futuristic Waveform Display on Virtual Trading Dashboard
Interactive financial dashboard showing teal bar chart with orange highlight and line graphs
Neon waveform bundle oscillating across futuristic digital dashboard with grid and data markers
Premium
Digital Analytics Dashboard with Gray Vertical Bars and Line Graphs
Digital Shield Padlock for Global Internet Security
Futuristic Data Analytics Dashboard with Neon Graphs
Colorful Stock Market Graph on Dark Grid Background Illustrating Global Economy Trends
Premium
Futuristic Data Visualization with Wavy Lines and Arrow
Digital White Dot Graph on Black Background
Innovative Digital Analysis Waveform with Futuristic Interface
Futuristic Data Processing Interface with Graphs
Premium
Digital Data Processing Background with Dynamic Lines
Zigzag Financial Trend Line with Candlesticks and Cyan Markers on Minimal Gray Background
Financial Data Visualization with Declining Trend Line
Digital Graphs and Interfaces Representing Data Analysis on Green Background
Premium
Digital Analytics Display with Candlestick Graph and User Engagement
DNA and Financial Graph Integration with Data Analytics Theme
Dynamic Financial Data Analysis Concept with Graph Lines and Orange Background
Abstract Data Processing with Digital Interface Graphics
Premium
Futuristic Data Interface with Colorful Digital Lines
Colorful Stock Market Graph with Data on Grid
Dynamic Data and Statistics Display on Purple Background
Futuristic Digital Data Visualization with Green Interfaces
Premium
Dynamic Social Media Analytics with Digital Line Graphs
Candlestick Chart with Moving Average for Data Analytics
Futuristic DNA Strand Connecting Technology and Data Concepts
Dynamic Diagrams of Data Processing on Digital Interface
Premium
Dynamic Financial Data Trends with Fluctuating Graphs and Charts
Dynamic Multicolored Graphs on Abstract Digital Finance Background
Abstract Digital Data Visualization with Red and Purple Bars
Data Processing Overlays on Secure Encryption Interface
Premium
Analytical Trading Dashboard with Rising Candlestick Charts
Neon Candlestick Chart with Codes and Data Visualization Concept
Futuristic Interface with DNA Helix and Coding Terminal
AI Data Processing with DNA Strand on Dark Digital Interface
Premium
Futuristic Visualization of Financial Data and Statistics
Financial Growth Arrows on Digital Grid Base
Futuristic Interface with Glowing Digital DNA and Data Visualization
Colorful Graph Analysis in Digital Interface Over Blue Background
Premium
Futuristic Neon Financial Chart with Candlestick Indicators
Financial Analytics Dashboard with Growth Trends and Indicators
Digital DNA Strand with Data Processing Elements
Futuristic Financial Data Analysis with Rising Stock Chart
Premium
Neon Candlestick Chart Visualizing Market Trend on Digital Finance Dashboard with Icons
Abstract Global Network with Dynamic Graphs
Neon Multicolor Waveform Displaying on Tech Dashboard with Teal Gridlines and Hex Icons
Futuristic Horizontal Neon Waveform Pulsing On Dark Analytics Dashboard With Code Overlay
Premium
Abstract Data Visualization with Neon Waveforms
Cyber Analytics Dashboard Showing Multicolor Waveforms on Neon Cyan Grid Interface
Financial Graph with Line Trending Upwards on Navy Background
Neon Analytics Dashboard Showing Real-Time Line Charts, Histogram Bars and Data Widgets
Premium
Neon Candlestick Chart Featuring Moving Averages, Segmented Trendline and Delta Labels on Trading UI
Futuristic Digital Data Visualization with Blue Waveforms
Holographic Neon Trend Lines Dashboard Showing Cyan and Orange Data Waves Over Grid
Digital Data Interface Display with Virtual Graphs
Premium
Digital Data Analysis Concept with Colorful Wave Graphs
Abstract Financial Graph on Dark Digital Background
Stock Market Analysis and Data Processing Graphic
Candlestick chart with red moving average line on dark financial analytics dashboard
Premium
Cyber Security with Data Wave and Digital Padlock Scanner
Analytics Dashboard with Dynamic Financial Data Visualization
Dynamic Red Arrow With Digital Wave Lines on Black Background
Digital Interface Displaying Fluctuating Analytics with Interactive Buttons
Premium
Dynamic Data Visualization Displaying Interactive Waveforms
Futuristic DNA Strand and Data Analytics Interface Concept
Interactive Financial Data Analysis with Digital Technology
Colorful Data Waveforms on Digital Analytics Dashboard Interface
Premium
Digital Dashboard With Candlestick Bar and Line Graph Interface
Pulse Waveform Display with Connected Data Nodes on Grid
Abstract Data Wave Patterns on Technology Interface
Digital Financial Data Processing Animation
Premium
Financial Trading Chart Overlaying World Map with Red Trend Line
Financial Data Analysis with Graphs on Grey Background
Futuristic Financial Charts with Virtual Arrows
Global Financial Data with Dynamic Analytics Visualization
Premium
Explore More Free Stock Images