
- Home >
- Stock Photos >
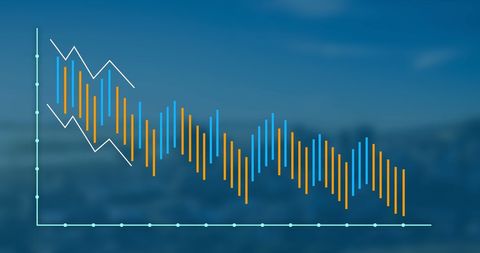
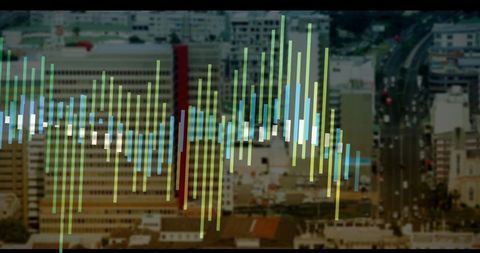
- Abstract Data Processing Visualization on Blue Gradient
Abstract Data Processing Visualization on Blue Gradient Image

Abstract visualization representing data processing and digital interfaces on a striking blue gradient backdrop. Suitable for illustrating concepts in global business, technology solutions, digital innovation, and financial analytics. Ideal for use in digital marketing materials, tech blogs, and corporate websites.
Powered by  - Get 15% off with code: PIKWIZARD15


downloads
Tags:
More
Credit Photo
If you would like to credit the Photo, here are some ways you can do so
Text Link
photo Link
<span class="text-link">
<span>
<a target="_blank" href=https://pikwizard.com/photo/abstract-data-processing-visualization-on-blue-gradient/5fb32cac7a1a2a819d9f887e02ee73d8/>PikWizard</a>
</span>
</span>
<span class="image-link">
<span
style="margin: 0 0 20px 0; display: inline-block; vertical-align: middle; width: 100%;"
>
<a
target="_blank"
href="https://pikwizard.com/photo/abstract-data-processing-visualization-on-blue-gradient/5fb32cac7a1a2a819d9f887e02ee73d8/"
style="text-decoration: none; font-size: 10px; margin: 0;"
>
<img src="https://pikwizard.com/pw/medium/5fb32cac7a1a2a819d9f887e02ee73d8.jpg" style="margin: 0; width: 100%;" alt="" />
<p style="font-size: 12px; margin: 0;">PikWizard</p>
</a>
</span>
</span>
Free (free of charge)
Free for personal and commercial use.
Author: Creative Art
Similar Free Stock Images

Premium


Premium


Premium


Premium


AI


Premium


AI


Premium


Premium

Premium


Premium


Premium


Premium


Premium


Premium


Premium


Premium

Premium


Premium


Premium


Premium


Premium


Premium


Premium


Premium


Premium


Premium


Explore More Free Stock Images