- Home >
- Stock Photos >
- Abstract Digital Data Analytics with 3D Red Chart
Abstract Digital Data Analytics with 3D Red Chart Image

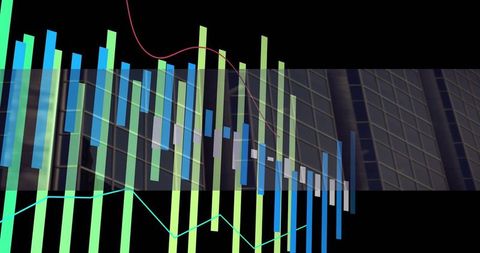
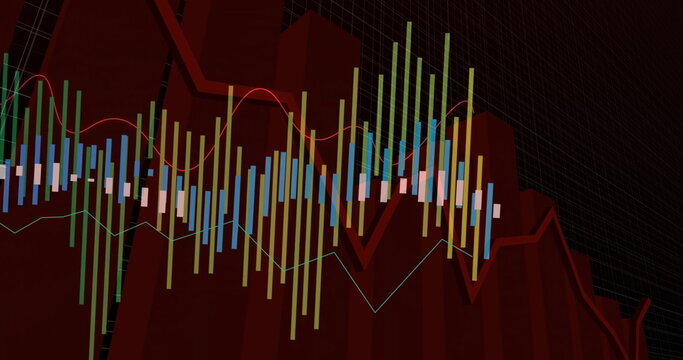
Vibrant 3D red columns are contrasted with multicolored segmented bars and trend lines on a black grid background, creating an impressive digital data visualization effect. This modern graphical illustration showcases elements of analyzing and interpreting quantitative data trends, ideal for technology, finance, or business-oriented content. Use for presentations, digital marketing assets, or as a backdrop for webinars discussing analytics and data-driven strategies.
Powered by 


downloads
Tags:
More
Credit Photo
If you would like to credit the Photo, here are some ways you can do so
Text Link
photo Link
<span class="text-link">
<span>
<a target="_blank" href=https://pikwizard.com/photo/abstract-digital-data-analytics-with-3d-red-chart/4bdea65ad7d65e3593ad1517ffaa420c/>PikWizard</a>
</span>
</span>
<span class="image-link">
<span
style="margin: 0 0 20px 0; display: inline-block; vertical-align: middle; width: 100%;"
>
<a
target="_blank"
href="https://pikwizard.com/photo/abstract-digital-data-analytics-with-3d-red-chart/4bdea65ad7d65e3593ad1517ffaa420c/"
style="text-decoration: none; font-size: 10px; margin: 0;"
>
<img src="https://pikwizard.com/pw/medium/4bdea65ad7d65e3593ad1517ffaa420c.jpg" style="margin: 0; width: 100%;" alt="" />
<p style="font-size: 12px; margin: 0;">PikWizard</p>
</a>
</span>
</span>
Free (free of charge)
Free for personal and commercial use.
Author: People Creations