
- Home >
- Stock Photos >
- Abstract Digital Data Visualization with Colorful Graphs
Abstract Digital Data Visualization with Colorful Graphs Image

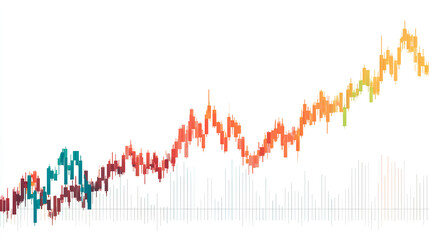
Lines and shapes combine to convey data analysis and technology trends in a colorful and captivating manner. Ideal for illustrating blogs about tech advancements, business analysis, or digital innovations.
Powered by 


downloads
Tags:
More
Credit Photo
If you would like to credit the Photo, here are some ways you can do so
Text Link
photo Link
<span class="text-link">
<span>
<a target="_blank" href=https://pikwizard.com/photo/abstract-digital-data-visualization-with-colorful-graphs/599e9cb6376b6830aedd3a597a025c08/>PikWizard</a>
</span>
</span>
<span class="image-link">
<span
style="margin: 0 0 20px 0; display: inline-block; vertical-align: middle; width: 100%;"
>
<a
target="_blank"
href="https://pikwizard.com/photo/abstract-digital-data-visualization-with-colorful-graphs/599e9cb6376b6830aedd3a597a025c08/"
style="text-decoration: none; font-size: 10px; margin: 0;"
>
<img src="https://pikwizard.com/pw/medium/599e9cb6376b6830aedd3a597a025c08.jpg" style="margin: 0; width: 100%;" alt="" />
<p style="font-size: 12px; margin: 0;">PikWizard</p>
</a>
</span>
</span>
Free (free of charge)
Free for personal and commercial use.
Author: Creative Art
Similar Free Stock Images

Premium


Premium

Premium


Premium

Premium


Premium


Premium


Premium


Premium


Premium


Premium


Premium


Premium


Premium

Premium
Premium


Premium


Premium


Premium


Premium


Premium

Premium

Premium


Premium


Premium


Explore More Free Stock Images