- Home >
- Stock Photos >
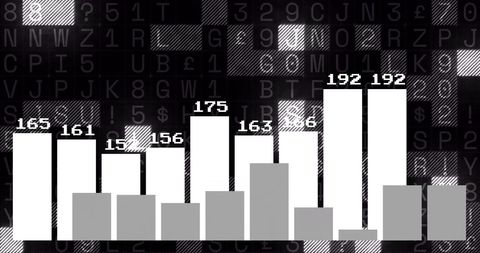
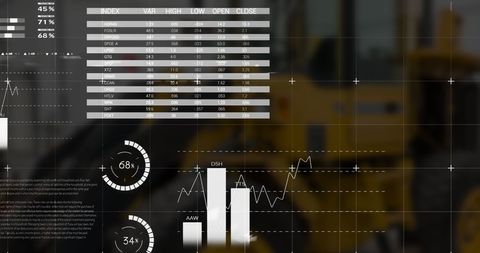
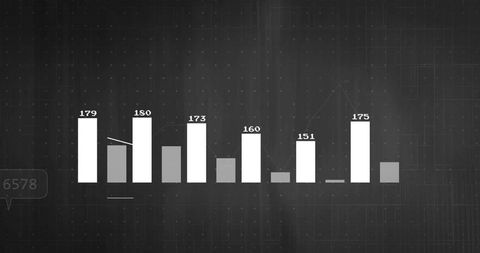
- Abstract Digital Financial Data on Black Background
Abstract Digital Financial Data on Black Background Image

This image captures an abstract representation of digital financial data displayed against a black background. Numbers are dynamically changing, evoking a sensation of constant motion exemplified in financial markets. The numbers and graphics blend to portray data processing within the world of finance and can effectively highlight themes of business finance, technology, economics, and global markets. Ideal for using in presentations, financial reports, websites related to economics or the technology sector, and banking newsletters, lending a technological and modern articulation to retail banking, stock market analysis, and data science projects.

downloads
Credit Photo
If you would like to credit the Photo, here are some ways you can do so
Free (free of charge)
Free for personal and commercial use.
Author: Creative Art