- Home >
- Stock Photos >
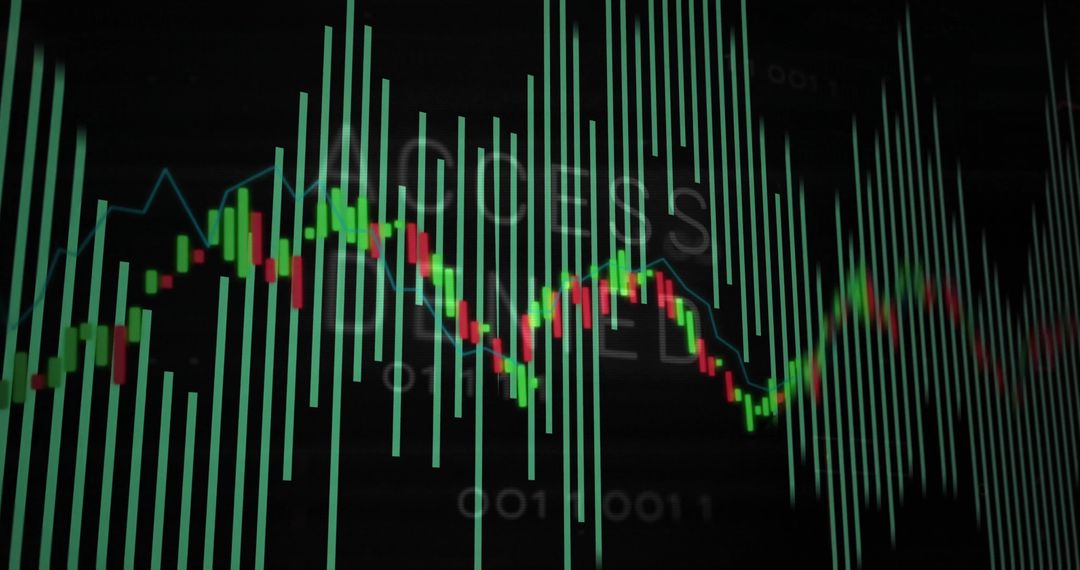
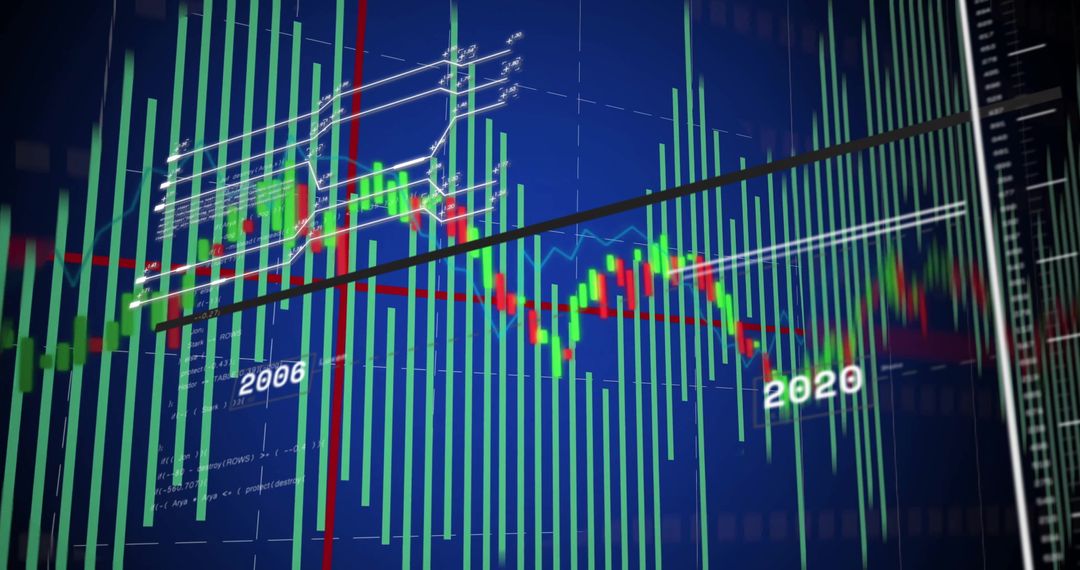
- Abstract Financial Chart with Dynamic Green Bars and Red Line
Abstract Financial Chart with Dynamic Green Bars and Red Line Image
Depicts abstract financial chart with prominent green bars alongside a red jagged line, overlayed by precise gridline and crosshair. Perfect for illustrating financial forecasts, investment decisions, big data interpretations, tech-focused presentations, and digital economy discussions.
Powered by 


0
downloads
downloads
Tags:
More
Credit Photo
If you would like to credit the Photo, here are some ways you can do so
Text Link
photo Link
<span class="text-link">
<span>
<a target="_blank" href=https://pikwizard.com/photo/abstract-financial-chart-with-dynamic-green-bars-and-red-line/aefdae67eb1baced2cd7ebde3a9047ed/>PikWizard</a>
</span>
</span>
<span class="image-link">
<span
style="margin: 0 0 20px 0; display: inline-block; vertical-align: middle; width: 100%;"
>
<a
target="_blank"
href="https://pikwizard.com/photo/abstract-financial-chart-with-dynamic-green-bars-and-red-line/aefdae67eb1baced2cd7ebde3a9047ed/"
style="text-decoration: none; font-size: 10px; margin: 0;"
>
<img src="https://pikwizard.com/pw/medium/aefdae67eb1baced2cd7ebde3a9047ed.jpg" style="margin: 0; width: 100%;" alt="" />
<p style="font-size: 12px; margin: 0;">PikWizard</p>
</a>
</span>
</span>
Free (free of charge)
Free for personal and commercial use.
Author: Creative Art
Similar Free Stock Images

Premium


Premium


Premium


Premium


Premium


Premium


Premium


Premium


Premium


Premium


Premium


Premium


Premium


Premium


Premium


Premium


Premium


Premium


Premium


Premium


Premium


Premium


Premium


Premium