- Home >
- Stock Photos >
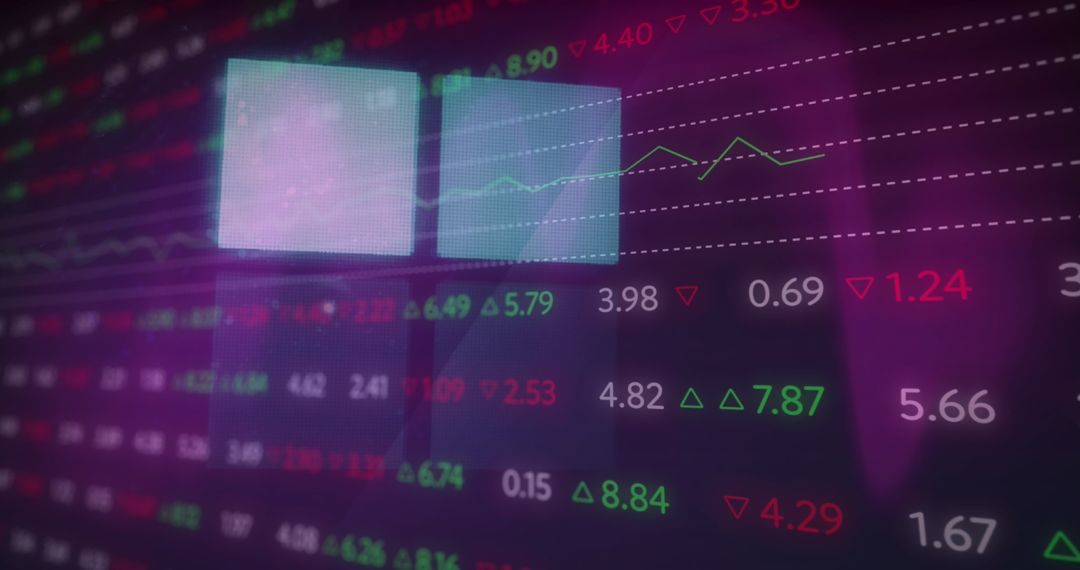
- Abstract Financial Data Digital Display with Blue Tint
Abstract Financial Data Digital Display with Blue Tint Image

This abstract image showcasing a digital display of stock market data with a blue tint is perfect for illustrating modern finance concepts. Highlighting connections within global business, it serves well in finance reports, business presentations, and technology websites to illustrate the interconnected world of finance.
Powered by 


2
downloads
downloads
Tags:
More
Credit Photo
If you would like to credit the Photo, here are some ways you can do so
Text Link
photo Link
<span class="text-link">
<span>
<a target="_blank" href=https://pikwizard.com/photo/abstract-financial-data-digital-display-with-blue-tint/38f3e1023a594623fedcf1e5a20429ee/>PikWizard</a>
</span>
</span>
<span class="image-link">
<span
style="margin: 0 0 20px 0; display: inline-block; vertical-align: middle; width: 100%;"
>
<a
target="_blank"
href="https://pikwizard.com/photo/abstract-financial-data-digital-display-with-blue-tint/38f3e1023a594623fedcf1e5a20429ee/"
style="text-decoration: none; font-size: 10px; margin: 0;"
>
<img src="https://pikwizard.com/pw/medium/38f3e1023a594623fedcf1e5a20429ee.jpg" style="margin: 0; width: 100%;" alt="" />
<p style="font-size: 12px; margin: 0;">PikWizard</p>
</a>
</span>
</span>
Free (free of charge)
Free for personal and commercial use.
Author: Awesome Content
Similar Free Stock Images

Premium


Premium


Premium


Premium


Premium


Premium


Premium


Premium


Premium


Premium


Premium


Premium


Premium


Premium


Premium


Premium


Premium


Premium


Premium


Premium


Premium


Premium


Premium


Premium