
- Home >
- Stock Photos >
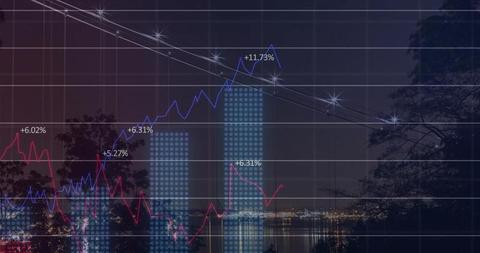
- Abstract Financial Data Visualization in Digital Display
Abstract Financial Data Visualization in Digital Display Image

Dynamic visualization illustrating complex financial datasets and stock market trends in a digital format. Financial sector professionals and analysts can use it to depict growth, trends, and real-time analysis in reports and presentations, enhancing their communicative and visual impact.
Powered by 


downloads
Tags:
More
Credit Photo
If you would like to credit the Photo, here are some ways you can do so
Text Link
photo Link
<span class="text-link">
<span>
<a target="_blank" href=https://pikwizard.com/photo/abstract-financial-data-visualization-in-digital-display/405c6b4919919cfa940c8ab5de6cea49/>PikWizard</a>
</span>
</span>
<span class="image-link">
<span
style="margin: 0 0 20px 0; display: inline-block; vertical-align: middle; width: 100%;"
>
<a
target="_blank"
href="https://pikwizard.com/photo/abstract-financial-data-visualization-in-digital-display/405c6b4919919cfa940c8ab5de6cea49/"
style="text-decoration: none; font-size: 10px; margin: 0;"
>
<img src="https://pikwizard.com/pw/medium/405c6b4919919cfa940c8ab5de6cea49.jpg" style="margin: 0; width: 100%;" alt="" />
<p style="font-size: 12px; margin: 0;">PikWizard</p>
</a>
</span>
</span>
Free (free of charge)
Free for personal and commercial use.
Author: Authentic Images
Similar Free Stock Images

Premium


Premium


Premium


Premium


Premium


Premium


Premium


Premium

Premium

Premium


Premium


Premium

Premium


Premium

Premium


Premium

Premium


Premium


Premium


Premium

Premium


Premium


Premium

Premium


Premium

Explore More Free Stock Images