- Home >
- Stock Photos >
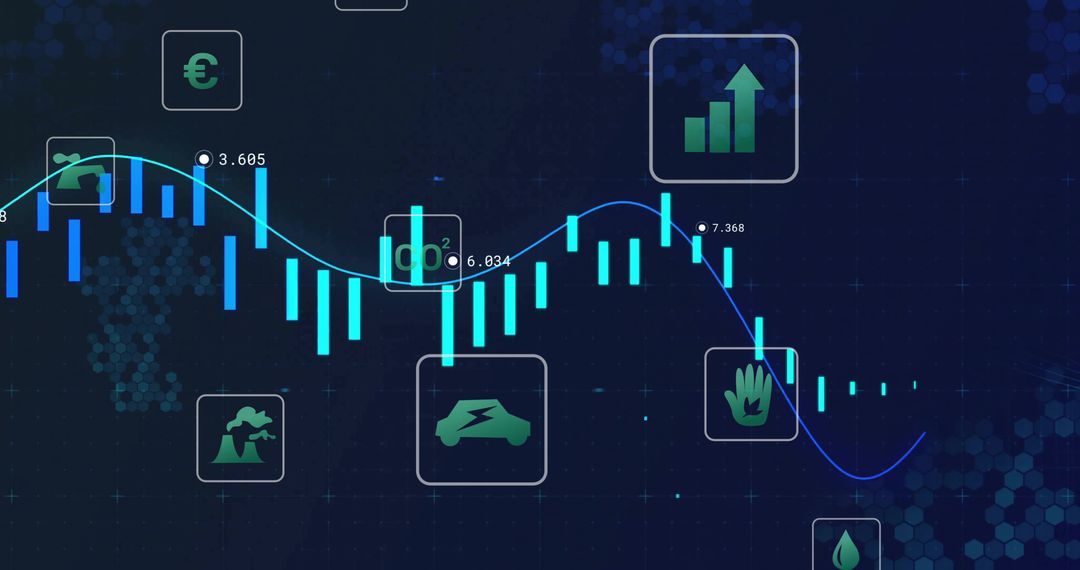
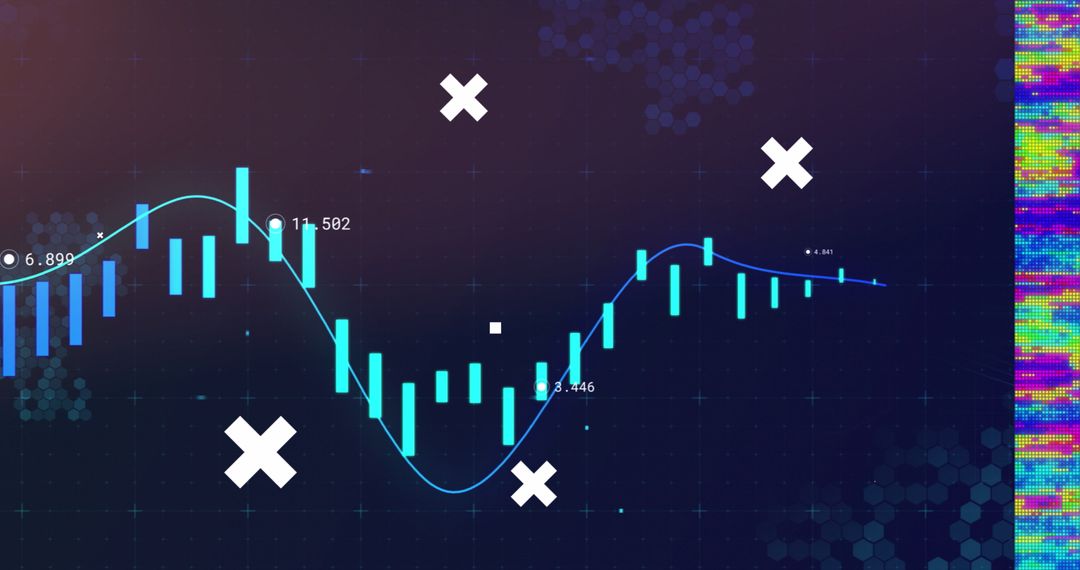
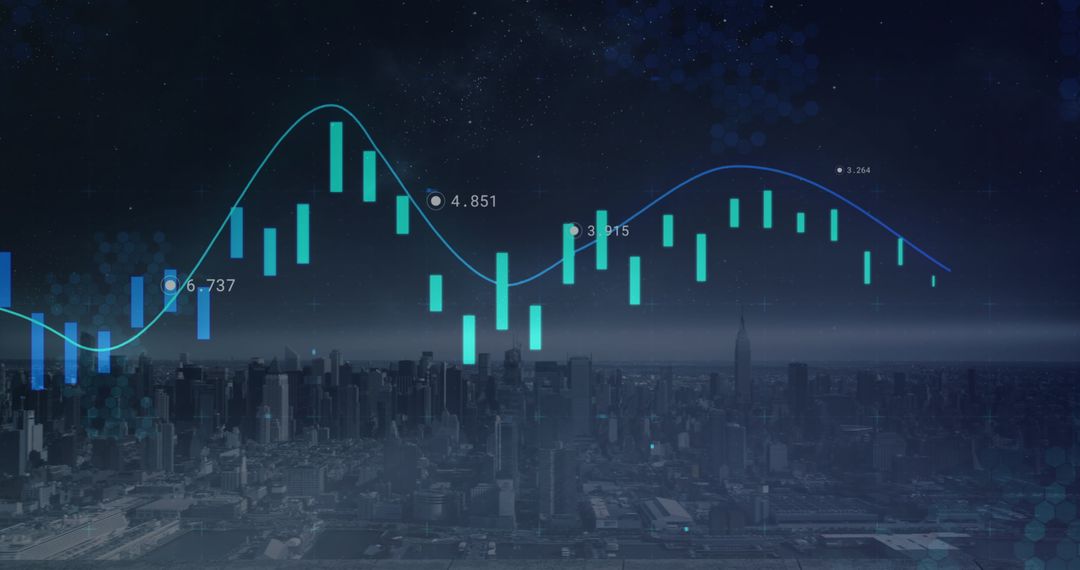
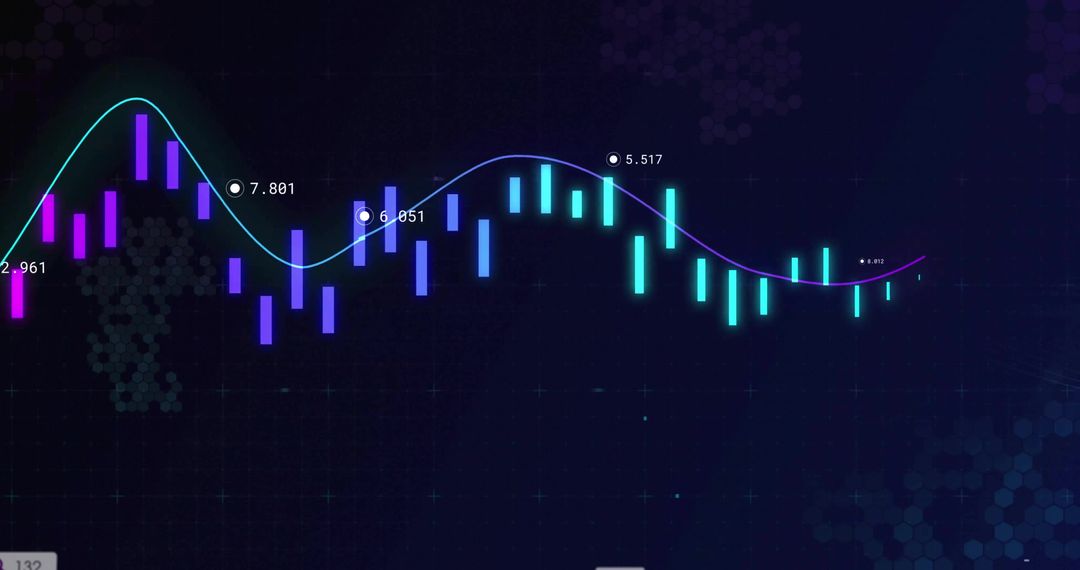
- Abstract Financial Graph with Trend Line and X Markers
Abstract Financial Graph with Trend Line and X Markers Image

Depiction of financial data with cyan bars and blue trend line on purple background. Potential uses include finance presentations, reports, data analysis visuals, financial market education, and other investment-related materials. Ideal for depicting stock market trends and investments.
Powered by 


0
downloads
downloads
Tags:
More
Credit Photo
If you would like to credit the Photo, here are some ways you can do so
Text Link
photo Link
<span class="text-link">
<span>
<a target="_blank" href=https://pikwizard.com/photo/abstract-financial-graph-with-trend-line-and-x-markers/899dfd72535fe25fc2cbb16fd750c78f/>PikWizard</a>
</span>
</span>
<span class="image-link">
<span
style="margin: 0 0 20px 0; display: inline-block; vertical-align: middle; width: 100%;"
>
<a
target="_blank"
href="https://pikwizard.com/photo/abstract-financial-graph-with-trend-line-and-x-markers/899dfd72535fe25fc2cbb16fd750c78f/"
style="text-decoration: none; font-size: 10px; margin: 0;"
>
<img src="https://pikwizard.com/pw/medium/899dfd72535fe25fc2cbb16fd750c78f.jpg" style="margin: 0; width: 100%;" alt="" />
<p style="font-size: 12px; margin: 0;">PikWizard</p>
</a>
</span>
</span>
Free (free of charge)
Free for personal and commercial use.
Author: Authentic Images
Similar Free Stock Images

Premium


Premium


Premium


Premium


Premium


Premium


Premium


Premium


Premium


Premium


Premium


Premium


Premium


Premium


Premium


Premium


Premium


Premium


Premium


Premium


Premium


Premium


Premium


Premium