1. Home > 
  2. Stock Photos > 
  3. Abstract Financial Graphs with Candlestick Chart Indicators

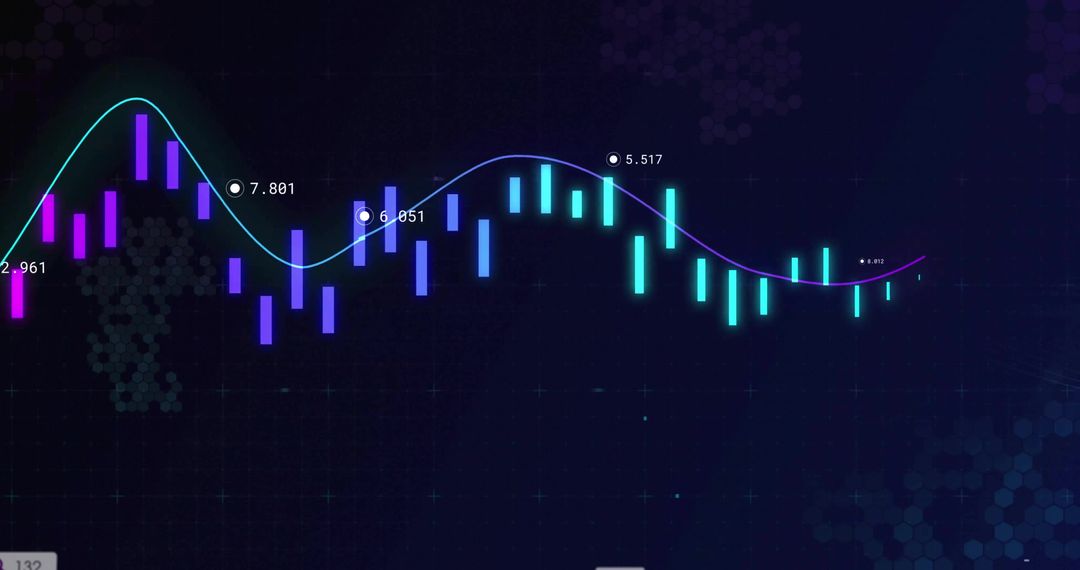
Abstract Financial Graphs with Candlestick Chart Indicators Image

Abstract Financial Graphs with Candlestick Chart Indicators

Featuring colorful candlestick and graphical elements against a dark background, this depiction is ideal for presentations on stock trading, financial strategies, and market analysis. Highlights the complexity of modern financial systems and is perfect for educational materials or business layouts.

Powered by Shutterstock logo - Get 15% off with code: PIKWIZARD15
Stock market graph trading analysis investment financial, stock exchange financial or forex graph stock market graph chart business crisis crash loss and grow up gain and profits win up trend - Powered by Shutterstock - Get 15% off with code: PIKWIZARD15Stock market financial investment and trading graph interface showing ticker price evolution with candlestick chart and moving average curves. Increasing profit. Forex. Person touching virtual screen. - Powered by Shutterstock - Get 15% off with code: PIKWIZARD15Stock market exchange loss trading graph analysis investment indicator business graph charts of financial board display candlestick crisis stock crash red price chart fall money  - Powered by Shutterstock - Get 15% off with code: PIKWIZARD15Stock market graph trading analysis investment financial, stock exchange financial or forex graph stock market graph chart business crisis crash loss and grow up gain and profits win up trend - Powered by Shutterstock - Get 15% off with code: PIKWIZARD15Stock market or forex trading graph and candlestick chart suitable for financial investment concept. Economy trends background for - Powered by Shutterstock - Get 15% off with code: PIKWIZARD15

Credit Photo

If you would like to credit the Photo, here are some ways you can do so

Free (free of charge)

Free for personal and commercial use.

Author: Awesome Content

Similar Free Stock Images

Digital Stock Market Graph with Dynamic Data Displays
Premium
Close-up of a hand using a magnifying glass to examine stock market candlestick charts. Visualizes financial analysis, trading strategies, and investment decision-making.
Colorful Digital Graph on World Map Depict Economic Trends
Dynamic Stock Market Analysis Overlay in Modern Office
Futuristic Digital Interface with Market Analysis
Futuristic Global Financial Data Analysis Background
Premium
Stock market or forex trading graph and candlestick chart suitable for financial investment concept. Economy trends background for business idea and all art work design. Abstract finance background
Digital Data Processing with Graphs and Coding Visualization
Digital Data Analysis Abstract Background with Graphs
Colorful Graph Representing Global Economy Stock Market Movement
Global Stock Market Graph on a Digital World Map
Premium
Financial stock market. Abstract financial chart with graph and stack of coins in Double exposure style background. Growing business graph with rising up trend
Digital Display of Inflation Concept Over Financial Trends Chart
Abstract Digital Market Analysis with Financial Charts
Financial Data Visualization Over Construction Site
Abstract Data Analytics with Futuristic Interface Design
Premium
Investing and stock market concept gain and profits with faded candlestick charts.
Digital Financial Data Over World Map in Data Center
Social Media Icons Floating Over Financial Data Processing
Colorful Financial Data Analytics and Global Market Trends
Futuristic Digital Data Graphs and World Map
Premium
Businessmen work with stock market investments using smartphones to analyze trading data. Stockmarket online trading chart candlestick on crypto currency platform
City Skyline with Digital Graph Representing Market Trends
Social Media Alerts Overlaying Financial Market Trends
Digital Financial Data Analysis on Circuit Board
Digital Financial Data and Graph Display with Codes
Premium
The red crashing market volatility of crypto trading with technical graph and indicator, red candlesticks going down without resistance, market fear and downtrend. Cryptocurrency background concept.
Financial Data Analysis with Graphs on Grey Background
Businessman Analyzing Financial Data with Graphs in Office
Abstract Financial Data Visualization on World Map Dashboard
Futuristic Financial Graph with Candlesticks and Wave Line
Colorful Stock Market Graph with LED Display Style
Colorful Financial Graph with Global Map Display
Premium
Stock market and business activity in Asia. Corporate value and stock movement. Stock market prices charts on tall buildings background.
Financial Charts with Data Streams Overtones in Office
Digital Financial Data Analysis with Graphs
Digital Financial Data Visualization Overlay in Cityscape
Digital Financial Chart Over Cityscape Backdrop
Premium
Closeup financial chart with uptrend line candlestick graph in stock market on monitor background
Global Financial Data Analysis Overlaid on World Map
Colorful Graph Displaying Stock Market Trends on Digital Grid
Cyber Security Overlies Stock Market Data with Network Connections
Digital Wave and Data Patterns in Stock Market Concept
Premium
Trading chart displayed on the screen of the laptop. Stock market, trend line in a candlestick form.
Digital Data Infographic Detail with Data Points and Graphs
Digital Data Security and Global Internet Connections Concept
Financial Data and Blood Vessels Fusion Exploring Adaptive Business Intelligence
Financial Data Analytics Over Urban Skyline Backdrop
Premium
Technical price graph and indicator, red and green candlestick chart on blue theme screen, market volatility, up and down trend. Stock trading, crypto currency background.
Digital Data Chart on Grey Background with Red Trend Line
Abstract Financial Data Visualization on Digital Screen with World Map
Global Business and Data Processing with Financial Metrics
Abstract Financial Data Concepts over Cityscape
Premium
Stock market or forex trading graph and candlestick chart suitable for financial investment concept. Economy trends background for business idea and all art work design. Abstract finance background.
Futuristic Financial Data Analysis with Binary Code Overlay
Financial Data Processing Code Over Digital Graph
Futuristic Data Processing with Bright Visual Graphs
Dynamic Financial Data with Interactive Graphs on Digital Screen
Premium
Closeup of stock market volatility of crypto trading with technical price graph and indicator, red and green candlesticks on blue display background
Global Data Visualization on Digital Interface Background
Futuristic Digital Financial Chart with Neon Networks
Analytical Dashboard with Candlestick Chart and Dotted Trend Line
Colorful Digital Stock Market Graph on Grid Background
Dynamic Stock Market Analysis Concept Chart
Financial Analysis with Digital Data and Vibrant Graph
Premium
Stockmarket online trading chart candlestick on crypto currency platform. Stock exchange financial market price candles graph data pattern analysis concept. Computer screen closeup background
Finance and Architecture Intersection with Data Analytics Overlay
Digital Financial Graphs and Data in Motion
Finance Data Learning: Economic Trends and Market Analysis
Abstract Financial Data with Neon Line Graph and Candlestick Chart
Premium
Digital money movement chart with crypto
Dynamic Digital Graph Overlay on World Map Illustrating Global Market Trends
Futuristic Financial Trading Graph with Purple Energy Wave
Global Financial Data Overlay with Vibrant Graphs on World Map
Global Business Data Analytics on World Map
Premium
Downtown city view of Chicago, skyline panorama over Lake Michigan, harbor area, sunset, Illinois, USA. Forex graph hologram. The concept of internet trading, brokerage and fundamental analysis
Digital Financial Data Technicolor Motion Chart
Digital Interface with Data Graphs and Charts on Blue Background
Visualizing Financial Data Trends Over Urban Backdrop
Futuristic Financial Data and Analytics Pathway
Premium
Stock market chart with green candlesticks going up indicating crypto rising in value. Graphical representation of volumes and time intervals of digital cryptocurrency past price movements
Abstract Financial Data and Globalization Symbols Simulation
Dynamic Financial Data on Orange Background
Dynamic Financial Data Processing Over Skyscrapers
Futuristic Financial Data Display Over Cityscape
Premium
graph and indicator, red and green candlestick chart on blue theme screen, market volatility, up and down trend. Stock trading, crypto currency background.
Stock Market Graphs Displaying Financial Analytics
Data Processing and Analytics on Global Finance Map
Global Digital Data Processing on World Map with Graph and Network Overlay
Abstract Digital Data Visualization and Analysis Background
Premium
chart, graph, finance, stock, analysis, financial, digital, growth, investment, investor. measuring level bar via indicator and pie chart virtual, risky business risk management control and strategy.
Futuristic Data Visualization with Highlighted Analytics Trends
Futuristic Financial Dashboard Showing Candlestick Trends, Dotted Ribbon Path and Alerts
Global Stock Market Data Over World Map with Neon Graphics
Abstract Stock Market Data Visualization
Dynamic Global Financial Data Representation
Digital Financial Data Overlayed on Office Scene
Premium
Stock market graph trading analysis investment financial, stock exchange financial or forex graph stock chart graph business crisis crash loss and grow up gain and profits win up trend growth money
Abstract Digital Interface with Glowing Data Metrics
Dynamic Financial Graphs Over City Background
Analyzing Data Trends with Futuristic Graph Interface
DNA Strand with Data Processing Interface Overlay
Premium
Computer Screen with Real-Time Stock Market Analytics, Candlestick Graphs and Financial Reports. Stock Exchange Software Template on a Monitor. Concept of a Stock Exchange, Economics and Business
Abstract Purple Wave Pattern Over Digital Stock Market Display
Abstract Financial Data and Stock Market Trading Concept
Colorful Digital Financial Analytics Interface for Data Visualization
Stagflation Concept with Digital Graphs and Data Patterns
Premium
Stock market or forex trading graph and candlestick chart suitable for financial investment concept. Economy trends background for business idea and all art work design. Abstract finance background.
Digital Stock Market Graph with Neon Cyan and Purple Elements
Digital Financial Data Over Cityscape Representation
Global Data Processing and Analytics on Dark Background
Global Financial Data Overlay on Digital World Map
Premium
Candlestick graph chart of stock and forex market to represent the revenue growth. the stock market crashed from covid19 and war, and waiting for reverse trend to investing in growth stocks.
Digital Data Flow Over Financial Cityscape
Digital Financial Statistics and Data Over Dark Background
Advanced Financial Data Network Over World Map
Digital Finance Data Overlay on Circuit Board
Premium
Earth sphere hologram with candlesticks and growing lines. Panoramic Bangkok cityscape at night. Concept of forex and investment, online trading and global market
Digital Data Processing with Code and Graphs on Black Background
Dynamic Stock Market Chart Overlay with Financial Data Visuals
Dynamic Financial Data Analysis on Dark Background
Digital Stock Market Chart with Candlesticks and Line Graph
Premium
Simple stock market exchange candlestick chart graph macro, closeup, shallow dof. Day trading candle sticks on screen, technical analysis financial concept, abstract blurry forex background texture
Futuristic Data Dashboard Displaying Neon Waveform, Candlestick Charts and Concentric HUD