- Home >
- Stock Photos >
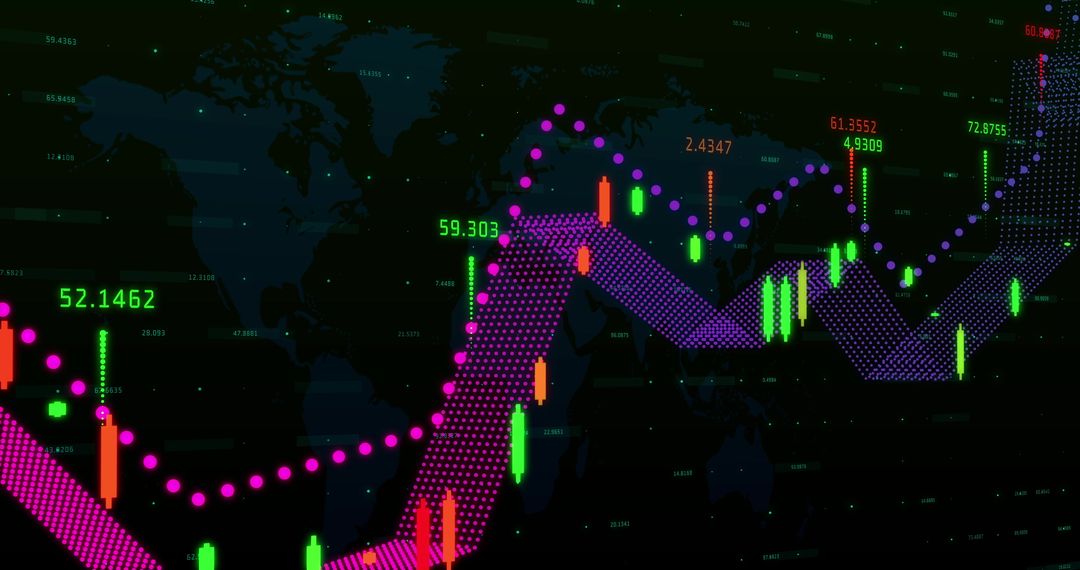
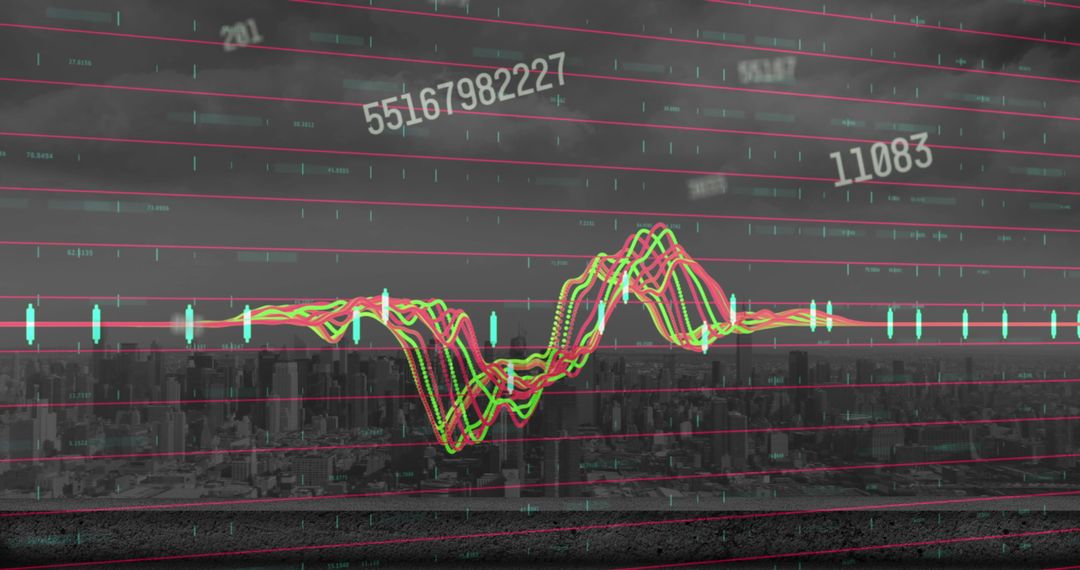
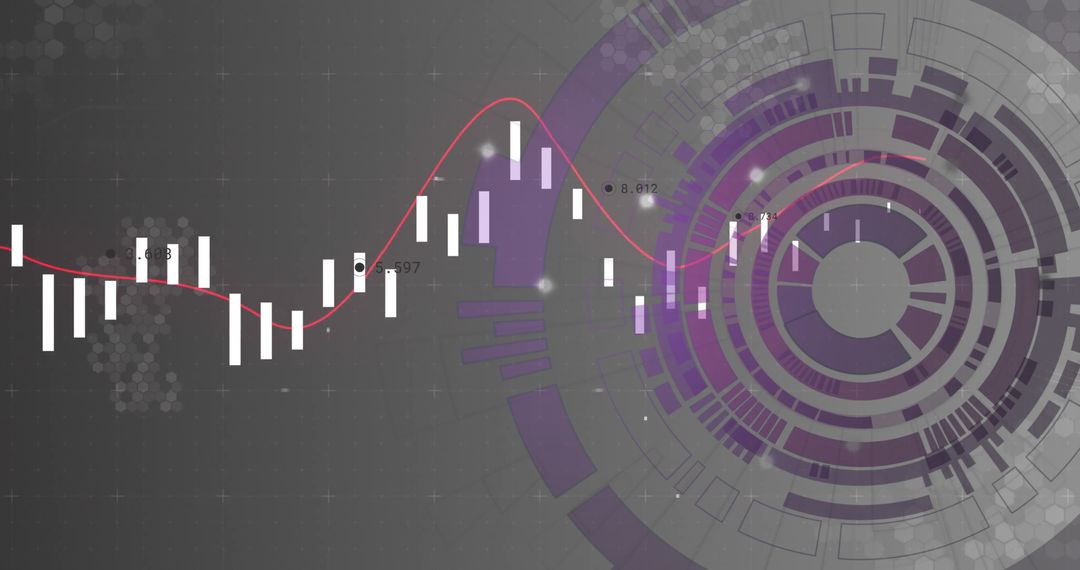
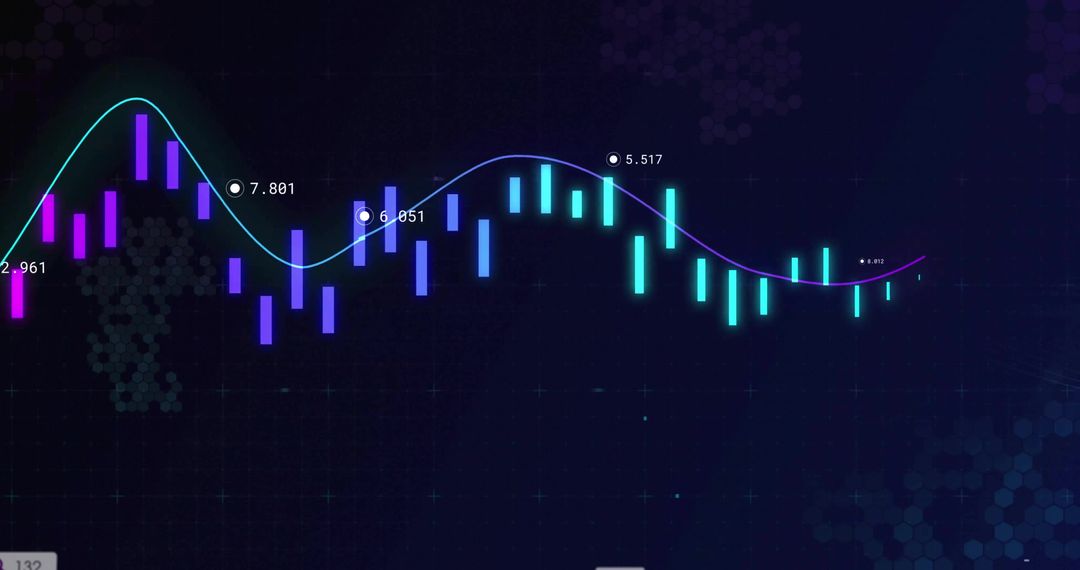
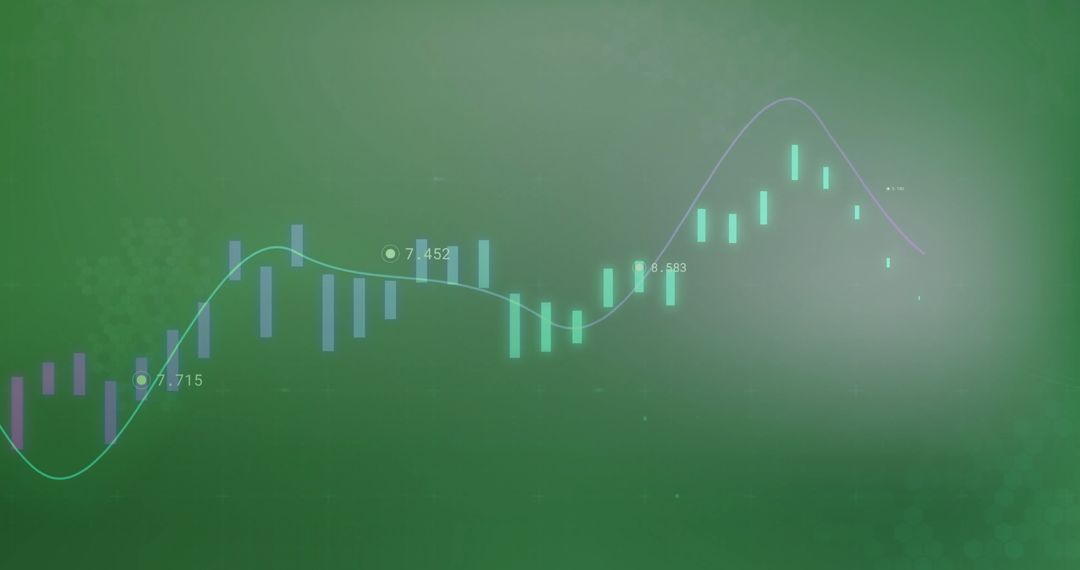
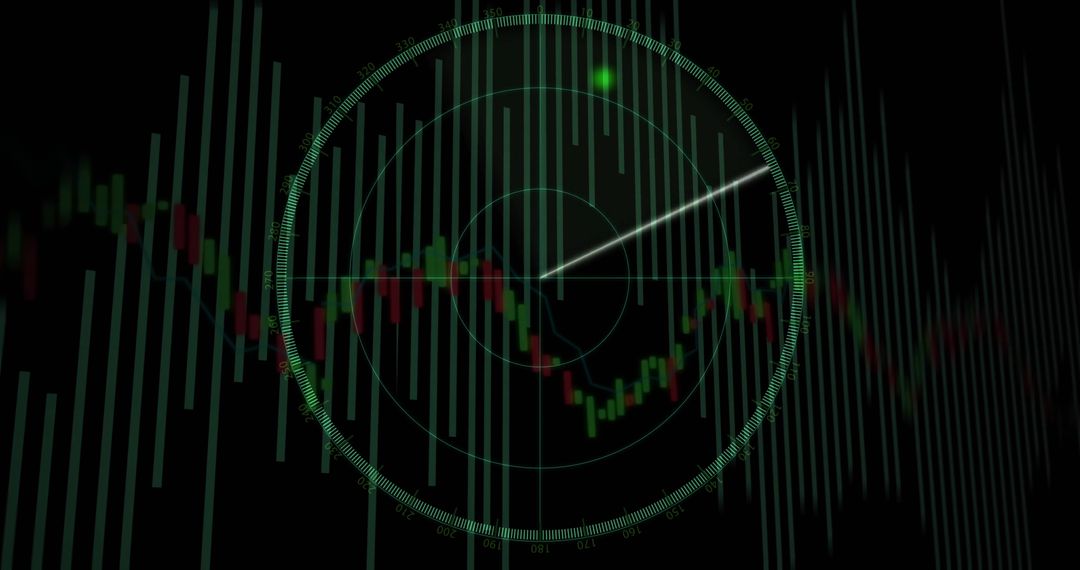
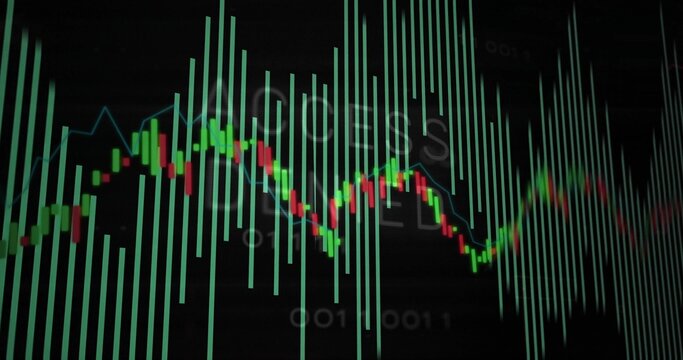
- Abstract Financial Visualization with Candlestick Chart and Trend Line
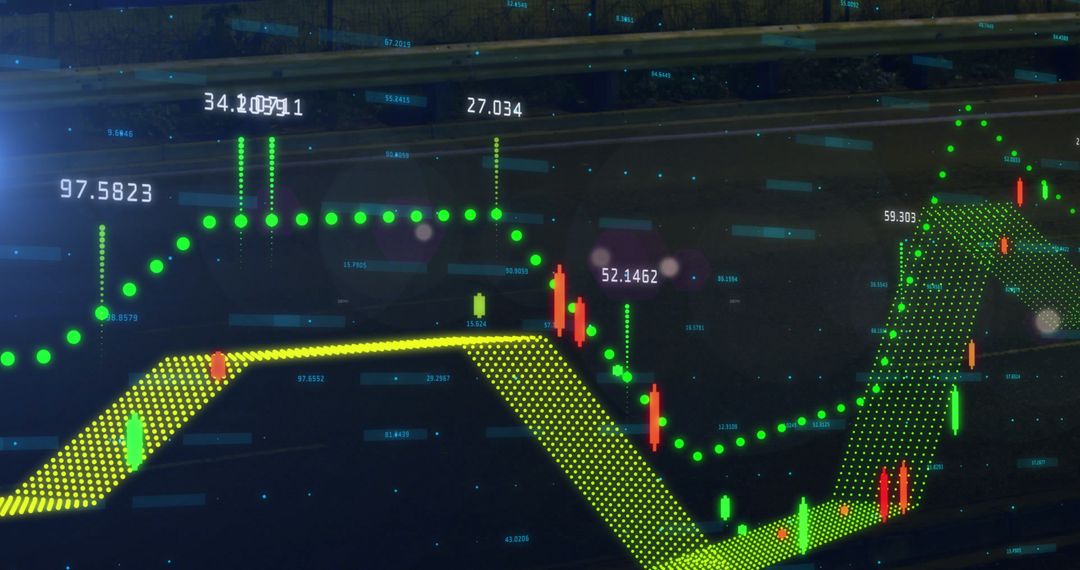
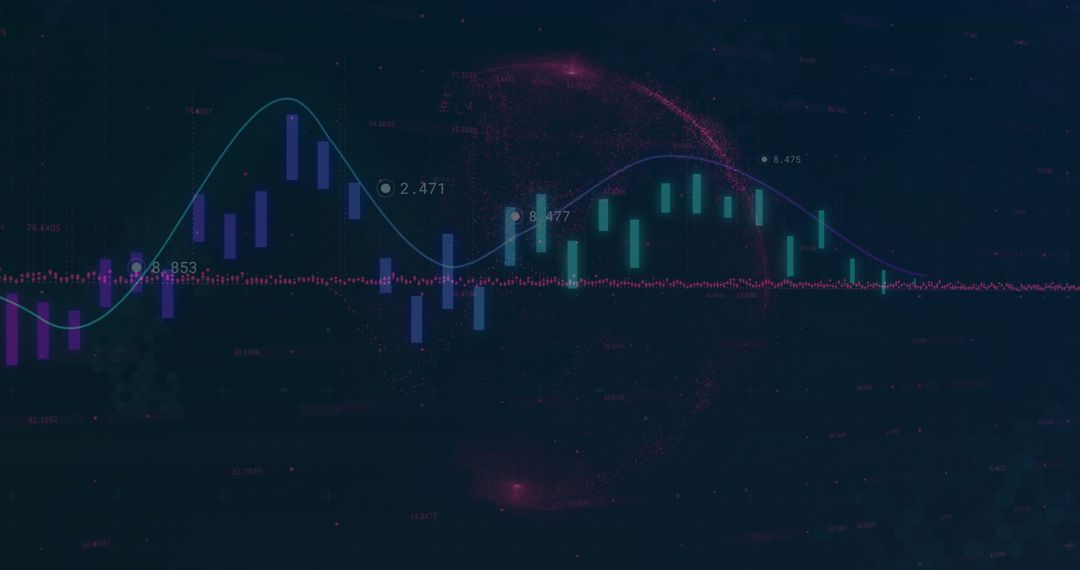
Abstract Financial Visualization with Candlestick Chart and Trend Line Image

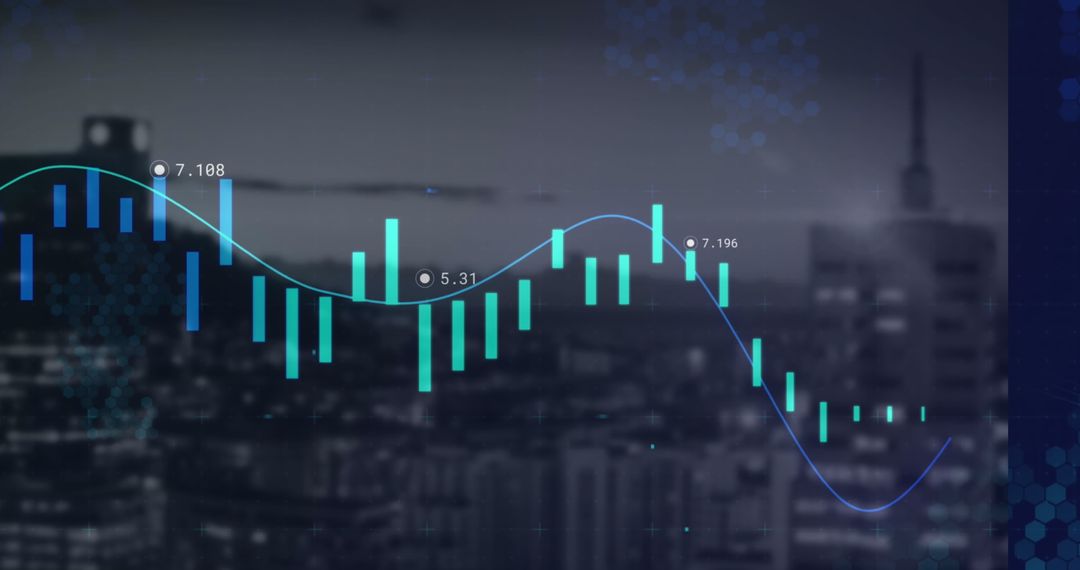
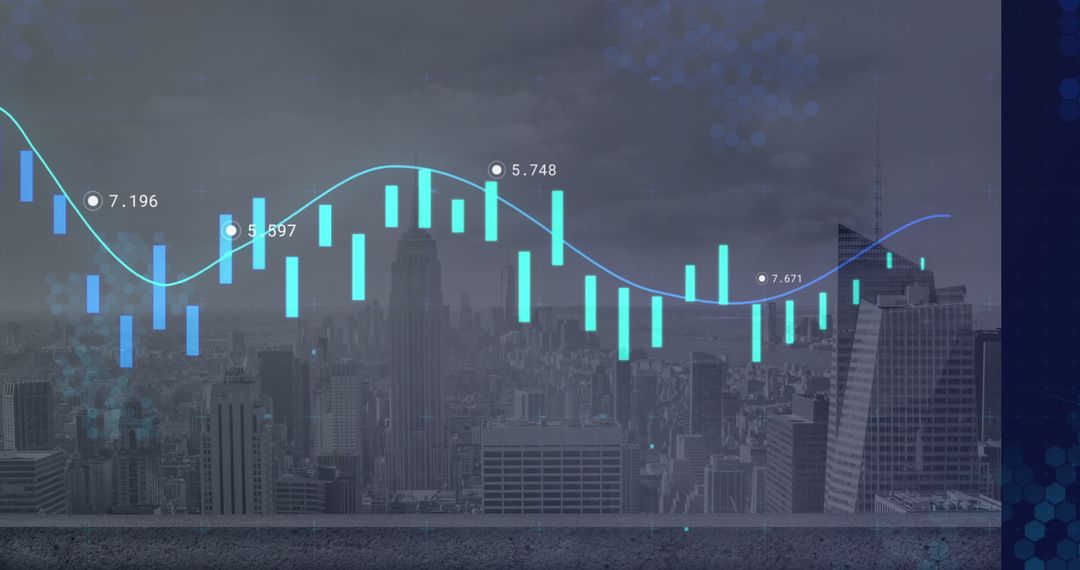
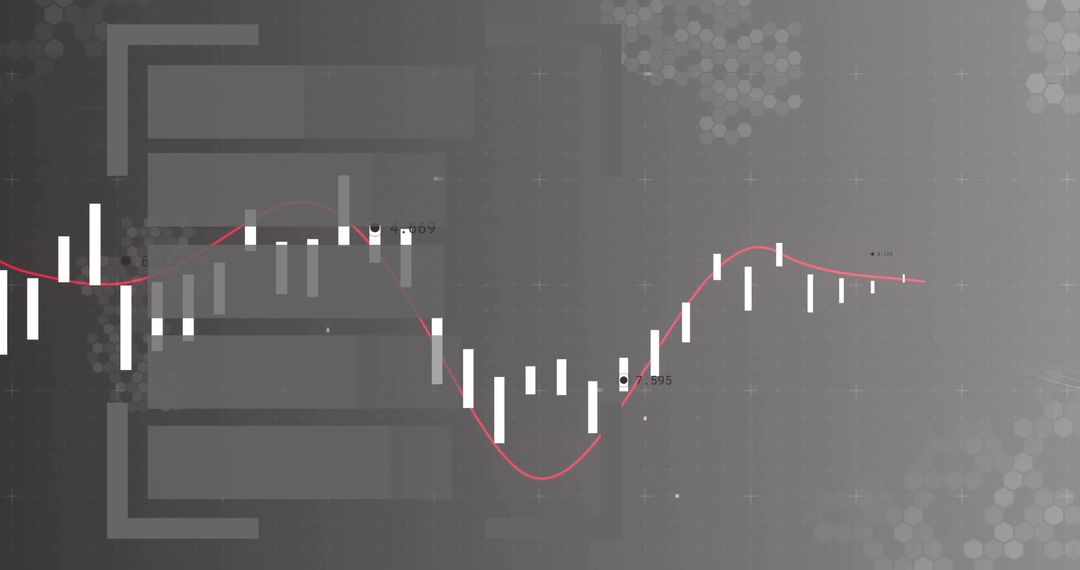
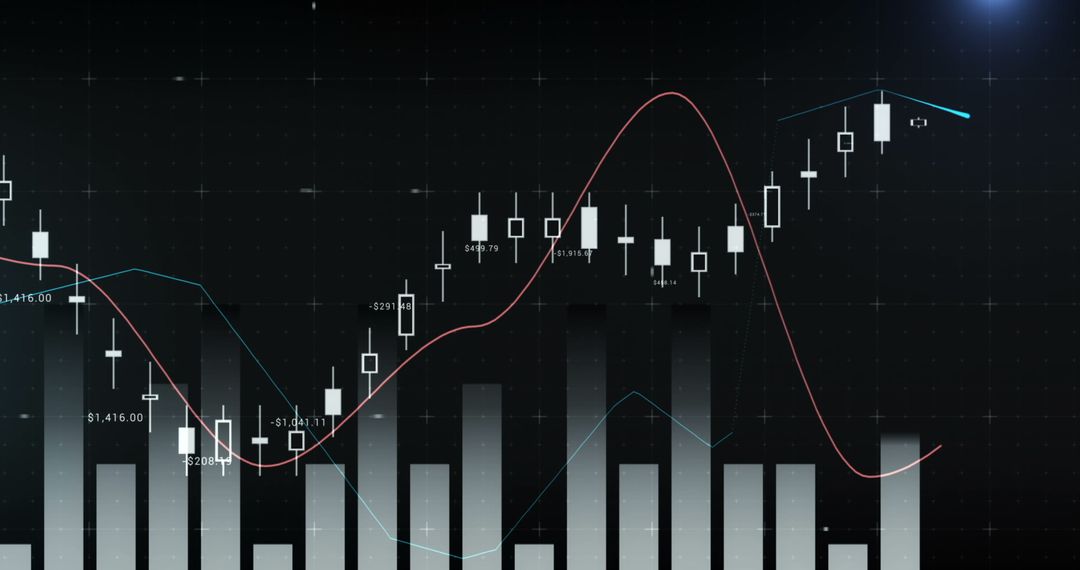
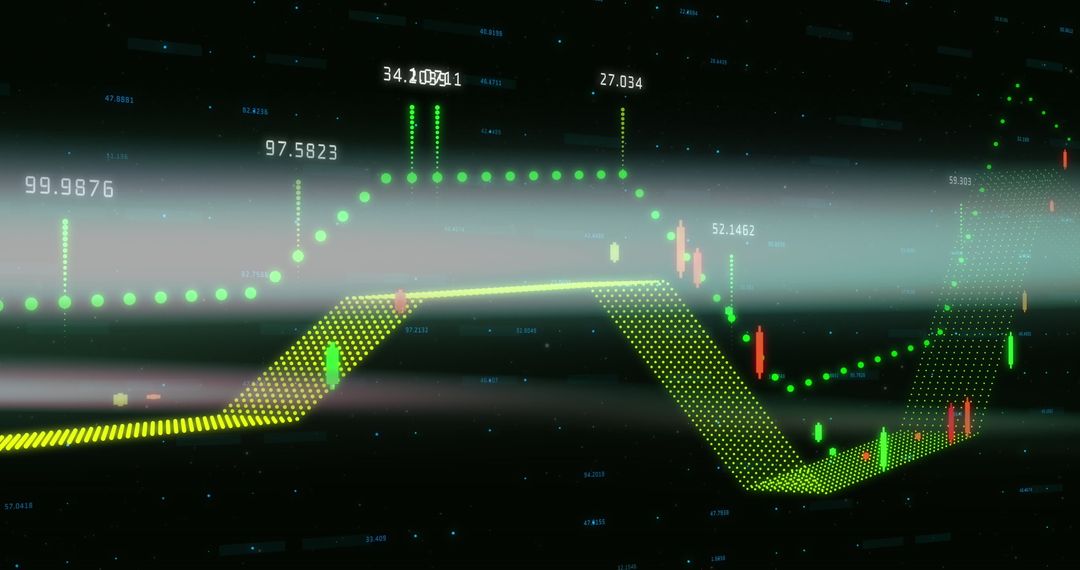
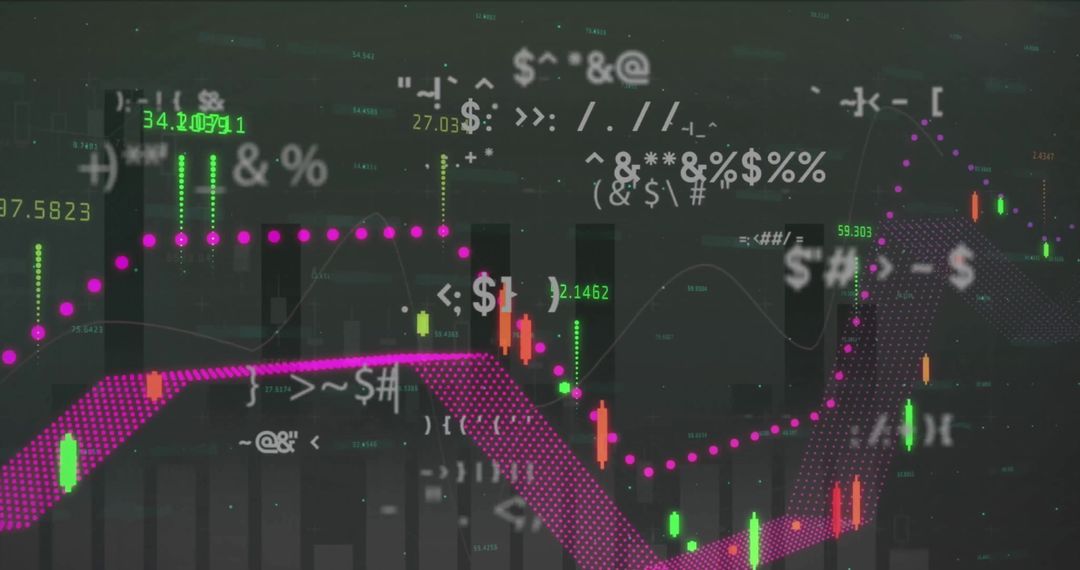
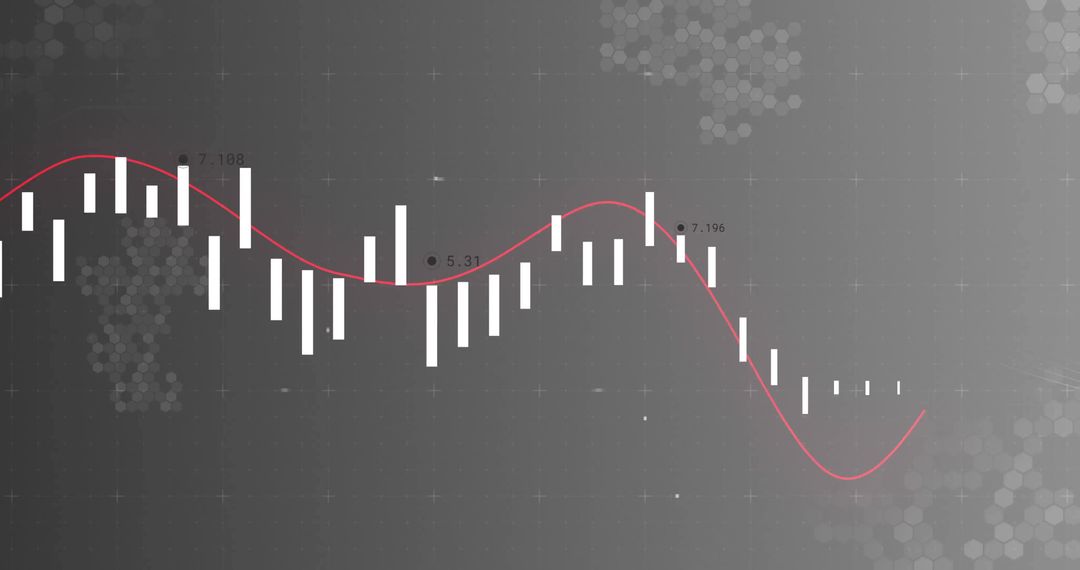
The image depicts a candlestick chart with a prominent red trend line, set against a backdrop of binary digits and a hexagonal grid pattern. This technology-themed representation effectively communicates concepts related to finance, data analysis, and digital trading. It can serve as a background for presentations related to economics, stock market trends, and financial analytics. Suitable for use by financial analysts, IT professionals, and anyone needing a modern, digital aesthetic in visual content.
Powered by 


2
downloads
downloads
Tags:
More
Credit Photo
If you would like to credit the Photo, here are some ways you can do so
Text Link
photo Link
<span class="text-link">
<span>
<a target="_blank" href=https://pikwizard.com/photo/abstract-financial-visualization-with-candlestick-chart-and-trend-line/75db4c8b65434dc6d52c07d206fca70a/>PikWizard</a>
</span>
</span>
<span class="image-link">
<span
style="margin: 0 0 20px 0; display: inline-block; vertical-align: middle; width: 100%;"
>
<a
target="_blank"
href="https://pikwizard.com/photo/abstract-financial-visualization-with-candlestick-chart-and-trend-line/75db4c8b65434dc6d52c07d206fca70a/"
style="text-decoration: none; font-size: 10px; margin: 0;"
>
<img src="https://pikwizard.com/pw/medium/75db4c8b65434dc6d52c07d206fca70a.jpg" style="margin: 0; width: 100%;" alt="" />
<p style="font-size: 12px; margin: 0;">PikWizard</p>
</a>
</span>
</span>
Free (free of charge)
Free for personal and commercial use.
Author: Creative Art