- Home >
- Stock Photos >
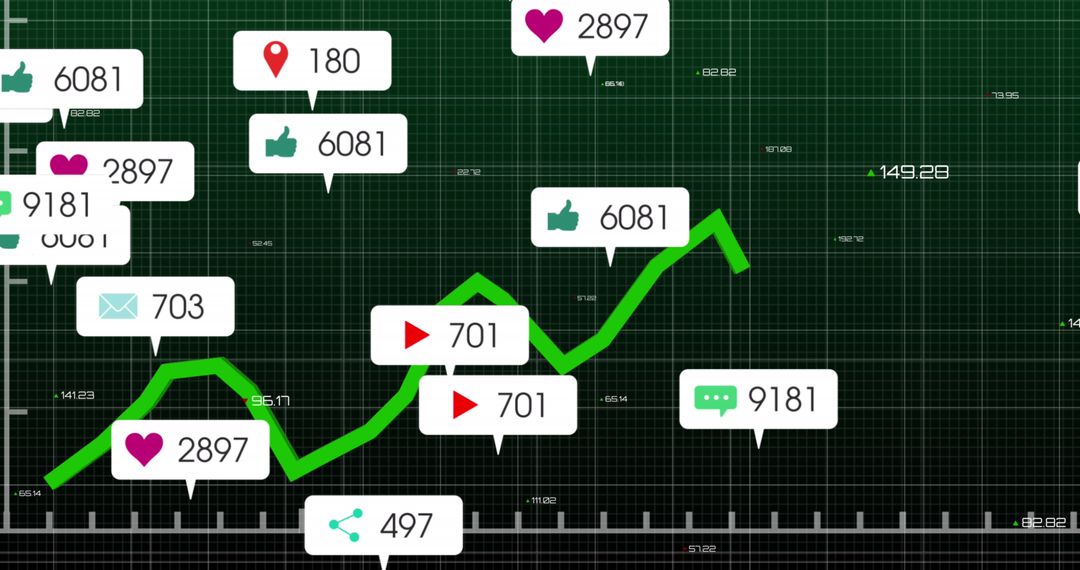
- Abstract Graph with Social Media Notification Icons and Data Points
Abstract Graph with Social Media Notification Icons and Data Points Image

Illustrates social media statistics with visual representation of notifications. Useful for articles, presentations, or reports discussing analytics, digital marketing strategies, or online engagement tracking.
Powered by  - Get 15% off with code: PIKWIZARD15


2
downloads
downloads
Tags:
More
Credit Photo
If you would like to credit the Photo, here are some ways you can do so
Text Link
photo Link
<span class="text-link">
<span>
<a target="_blank" href=https://pikwizard.com/photo/abstract-graph-with-social-media-notification-icons-and-data-points/2dc153a3d4ca472ecde789b203d8f704/>PikWizard</a>
</span>
</span>
<span class="image-link">
<span
style="margin: 0 0 20px 0; display: inline-block; vertical-align: middle; width: 100%;"
>
<a
target="_blank"
href="https://pikwizard.com/photo/abstract-graph-with-social-media-notification-icons-and-data-points/2dc153a3d4ca472ecde789b203d8f704/"
style="text-decoration: none; font-size: 10px; margin: 0;"
>
<img src="https://pikwizard.com/pw/medium/2dc153a3d4ca472ecde789b203d8f704.jpg" style="margin: 0; width: 100%;" alt="" />
<p style="font-size: 12px; margin: 0;">PikWizard</p>
</a>
</span>
</span>
Free (free of charge)
Free for personal and commercial use.
Author: Authentic Images
Similar Free Stock Images

Premium


Premium


Premium


Premium


Premium


Premium


Premium


Premium


Premium


Premium


Premium


Premium


Premium


Premium


Premium


Premium


Premium


Premium


Premium


Premium


Premium


Premium


Premium


Premium