- Home >
- Stock Photos >
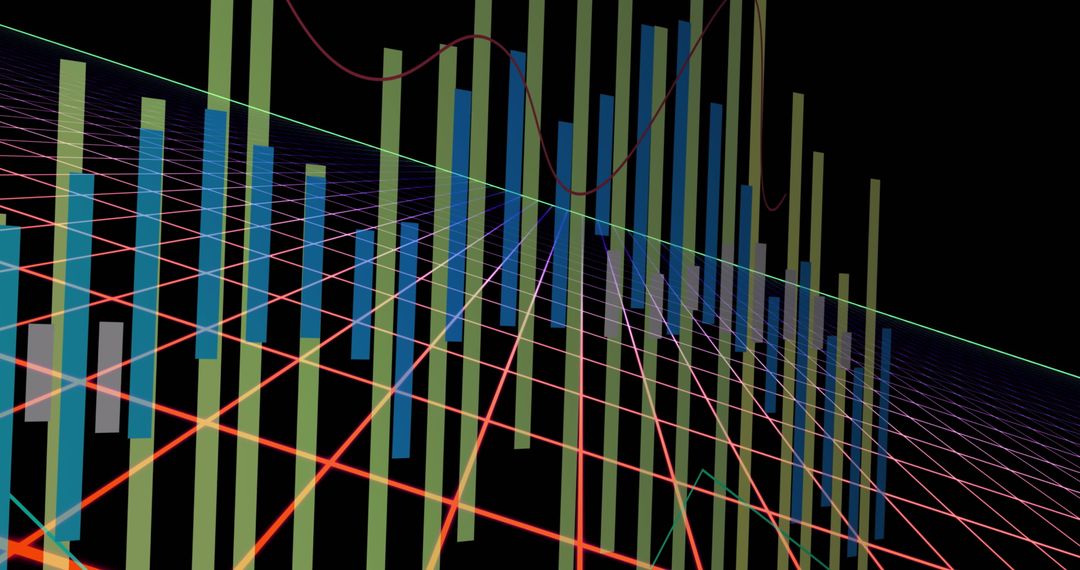
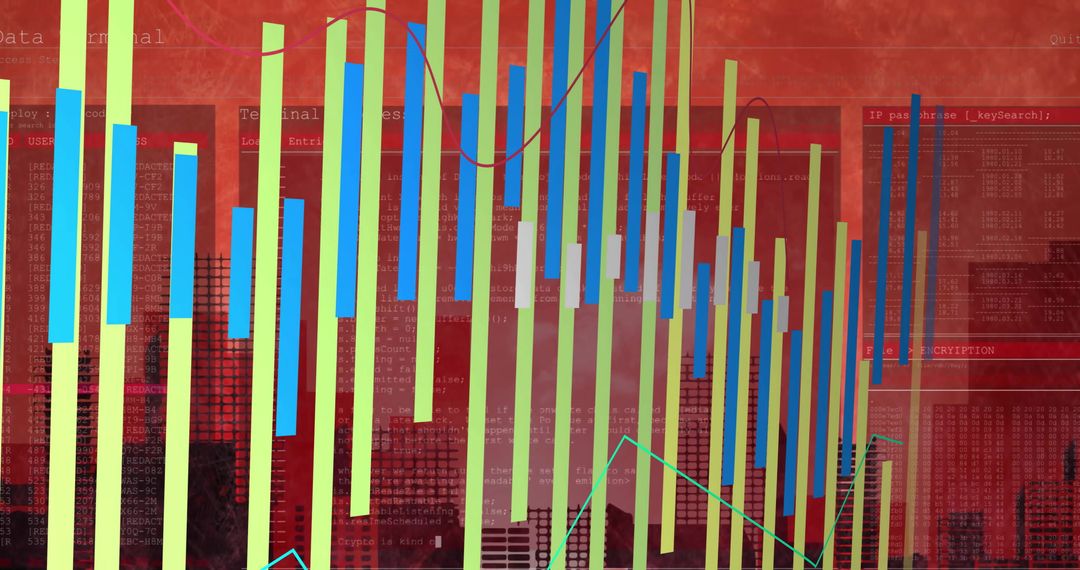
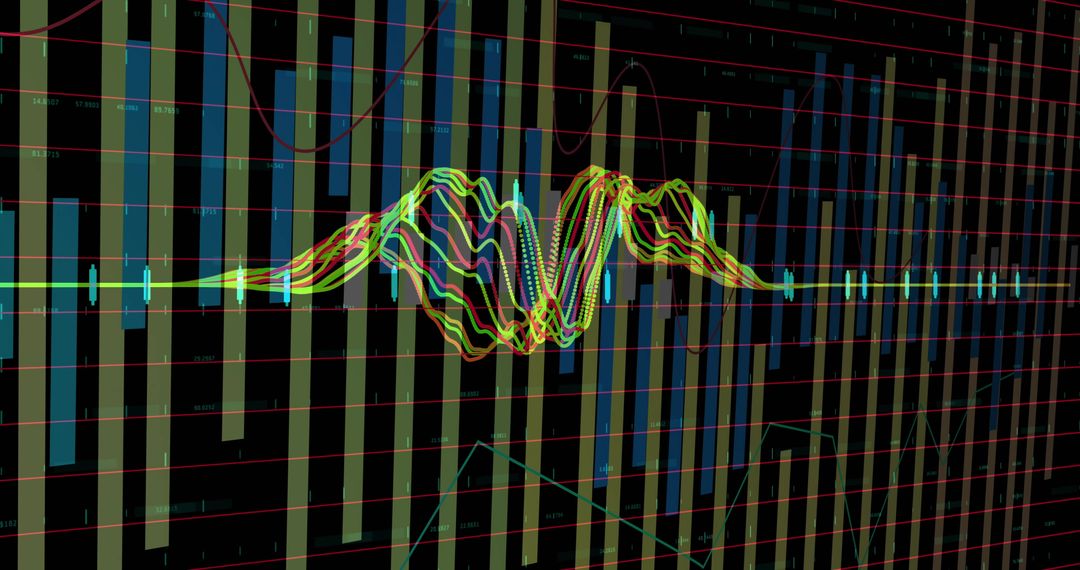
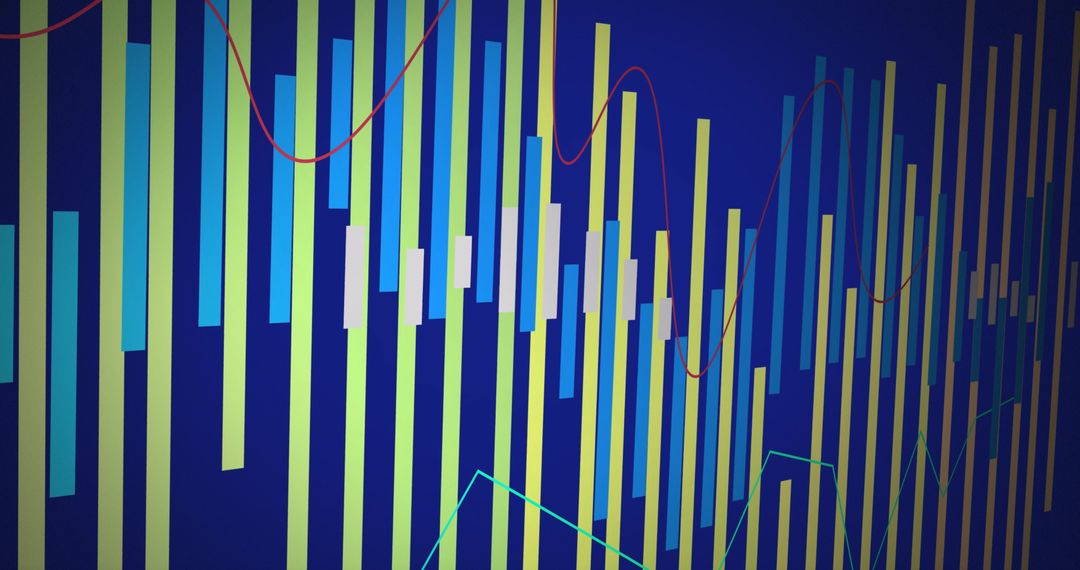
- Abstract HUD visualization with neon green rings, vertical bars, glowing gridlines
Abstract HUD visualization with neon green rings, vertical bars, glowing gridlines Image

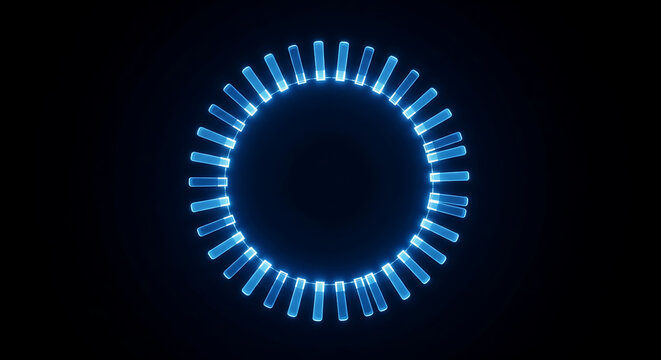
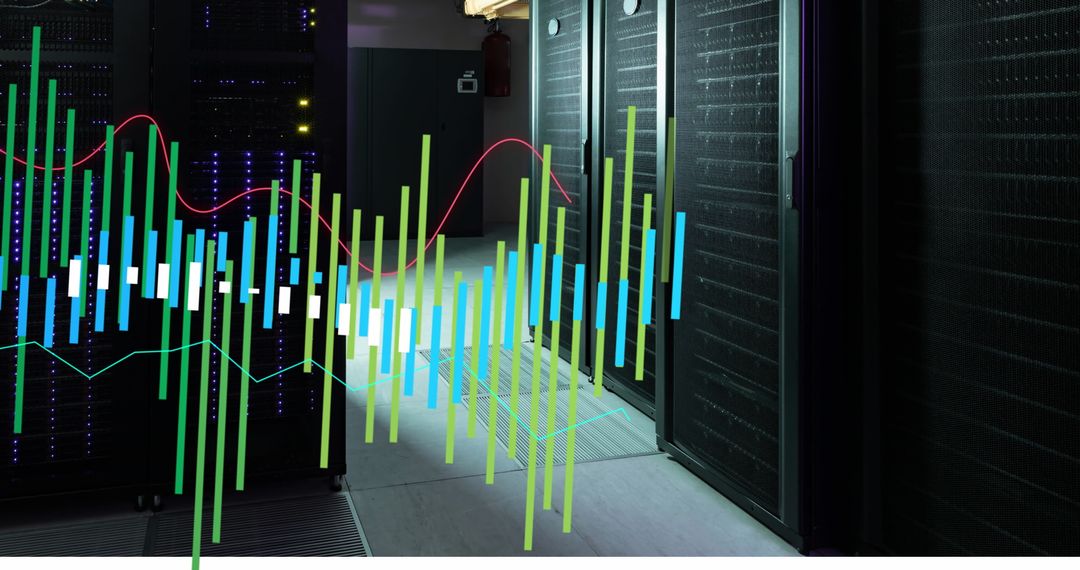
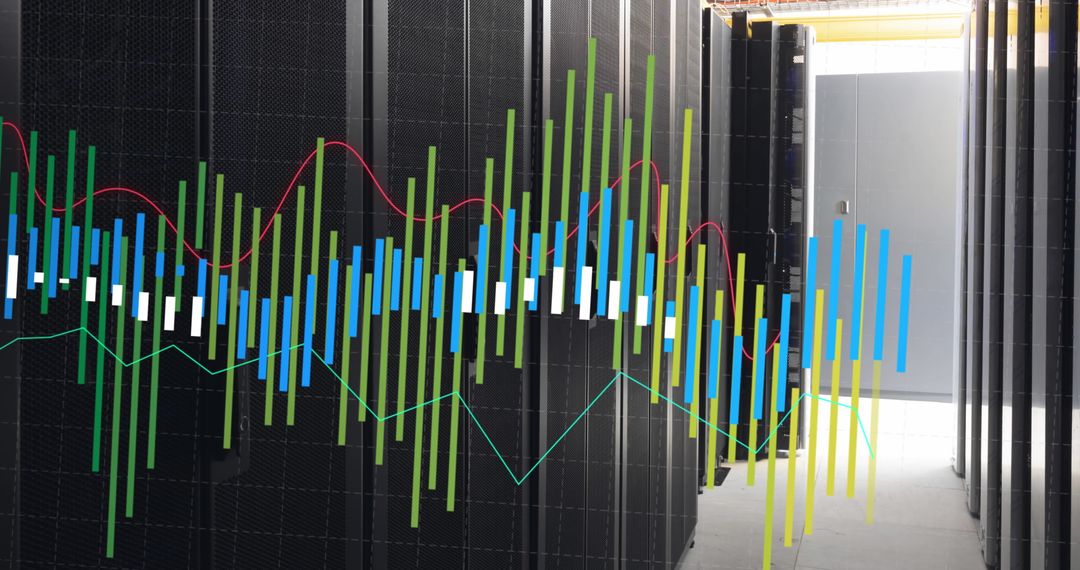
Featuring dominant neon green concentric rings intersecting vertical data bars with cyan and red trace lines, visual conveys futuristic data flow and signal processing. Color palette combining neon green and cool blues with dark background creating high-contrast cyber look. Perfect for tech website headers, software dashboard backgrounds, cybersecurity campaigns, fintech presentations, and motion graphics overlays. Works well as abstract backdrop for product launches, UI mockups, infographic slides, social media posts, and video title sequences. High-energy composition supporting themes of analytics, network monitoring, radar detection, and futuristic interface design.
Powered by 


0
downloads
downloads
Tags:
More
Credit Photo
If you would like to credit the Photo, here are some ways you can do so
Text Link
photo Link
<span class="text-link">
<span>
<a target="_blank" href=https://pikwizard.com/photo/abstract-hud-visualization-with-neon-green-rings-vertical-bars-glowing-gridlines/9d13137d5a453b744831260962743d80/>PikWizard</a>
</span>
</span>
<span class="image-link">
<span
style="margin: 0 0 20px 0; display: inline-block; vertical-align: middle; width: 100%;"
>
<a
target="_blank"
href="https://pikwizard.com/photo/abstract-hud-visualization-with-neon-green-rings-vertical-bars-glowing-gridlines/9d13137d5a453b744831260962743d80/"
style="text-decoration: none; font-size: 10px; margin: 0;"
>
<img src="https://pikwizard.com/pw/medium/9d13137d5a453b744831260962743d80.jpg" style="margin: 0; width: 100%;" alt="" />
<p style="font-size: 12px; margin: 0;">PikWizard</p>
</a>
</span>
</span>
Free (free of charge)
Free for personal and commercial use.
Author: People Creations
Similar Free Stock Images

Premium


Premium


Premium


Premium


Premium


Premium


Premium


Premium


Premium


Premium


Premium


Premium


Premium


Premium


Premium


Premium


Premium


Premium


Premium


Premium


Premium


Premium


Premium


Premium