1. Home > 
  2. Stock Photos > 
  3. Abstract Stock Market Data with Graphs and Numbers

Abstract Stock Market Data with Graphs and Numbers Image

Abstract Stock Market Data with Graphs and Numbers

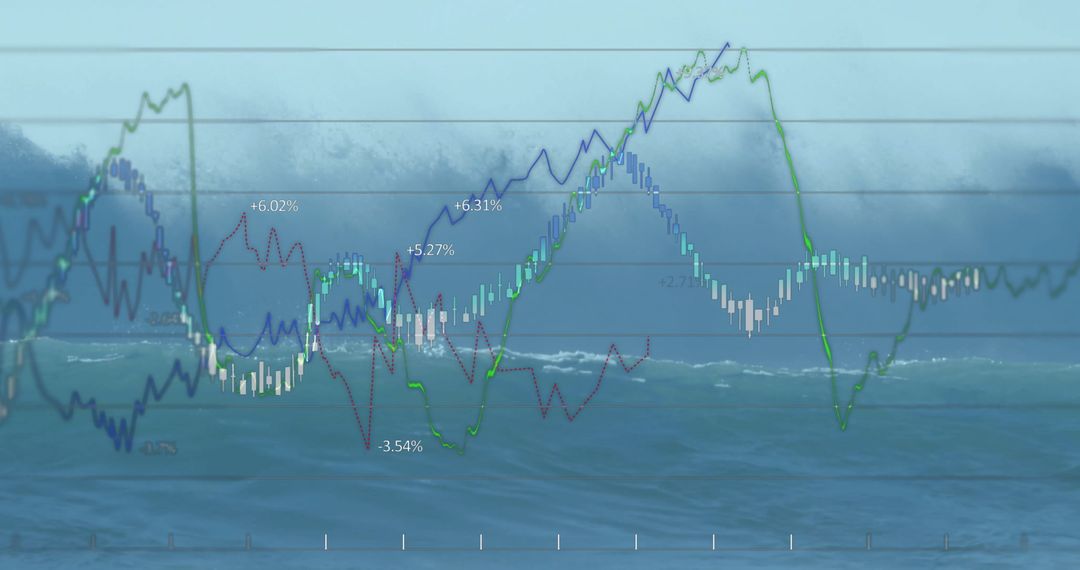
This digitally generated art features financial data with overlayed graphs and numerical information. It showcases essential elements of stock market fluctuations and investment analysis. Suitable for financial news articles, blogs on global business trends, investment presentations, or economic analytics reports.

Powered by Adobe logo

Dynamic blue and green digital stock market graph with bar charts and lines on a dark background, representing financial data analysis, investment trends, business growth, and global economy fluctuat - Powered by AdobeChess pieces on board with financial graphs overlay. Business strategy concept, decision making, competitive analysis, investment planning visualized through strategic game setup, market data. - Powered by AdobeData analyzing and stock market visualization with digital charts, financial dashboards, and performance metrics. Ideal for investment analysis, trading strategy, and economic forecasting. - Powered by AdobeThe magnifying glass highlighting financial data and market trends on paper. - Powered by AdobeBusinessman analyzing financial market data on a digital screen with a pen and stock charts in a high-tech office environment for investment and trading analysis - Powered by Adobe

Credit Photo

If you would like to credit the Photo, here are some ways you can do so

Free (free of charge)

Free for personal and commercial use.

Author: Creative Art

Similar Free Stock Images

Red Declining Graph on Digital Grid Display Represents Falling Markets
Premium
Close-up of businesswoman eyes, wearing glasses with blue tint, focusing on financial charts. Woman face is framed by gray background, emphasizing her eyes and glasses. Financial data analysis.
Financial Data Displayed Over City Skyline with Rising Graphs
Dynamic Financial Data Graphs Networking in Global Business
Financial Data Analysis with Global Digital Interface
Financial Data Streaming with Arrows Over Graphic Indicators
Premium
Smiling business woman uses tablet analyzing stock market data at night. Financial growth graphs, data trends overlaid on screen. Successful trader investor monitors investment performance on digital
Financial Chart and Rotating Globe on Digital Grid Background
Financial Stock Market Data Analysis on Digital Interface
Financial Data Charts in Shimmering Blue Digital Space
Dynamic Graphs and Digital Networks Overlay
Premium
Advanced robotic assistants working in a modern office analyzing financial data on computer screens with stock market graphs
Dynamic Glowing Digital Graphs on 3D Grid Background
Dynamic Financial Data Chart Display with Graphical Analysis
Abstract Financial Graphs with Rising Trends and Positive Indicators
Rising Financial Graph on Purple Background
Premium
Digital glowing stock market chart with options trend and index data on a dark background, symbolizing economic growth, trading, and financial technology.
Dynamic Financial Data Visualization on Digital Grid Background
Financial Data Graphs and Technology Interface Background
Dynamic Financial Data Against Urban Skyline
Innovative Stock Market Analysis Illustration with Digital Graphs
Premium
A businessman in a suit watches stock market data on a large monitor in a modern office while analyzing financial graphs and charts displayed.
Data Visualization on Digital Grid with Technological Interface
Financial Data Analysis with Abstract Chart Grid Overlay
Abstract Financial Data Graphics Illustrating Analysis
Dynamic Financial Data Overlaid on Grid Background
Premium
abstract colorful bar graph showing business growth and financial success with data analysis and market trends for corporate presentation and website
Financial Data with Molecular Background Concept
Financial Growth Statistic Data Processing Over Urban Cityscape
Abstract Data Analytics with City Silhouette
Futuristic Analytics Graph with Cyan-Orange Line Trends
Dynamic Stock Market Trends with Graphs on Digital Display
Dynamic Stock Market Graphs with Finance Data
Premium
ESG, Environment and Investment Green plants growing in front of financial graphs and charts.
Digital Financial Data and Global Business Analytics
Digital Financial Data with Arrows Indicating Growth
Financial Data Overlay on Cityscape Visualizing Market Trends
Dynamic Financial Data Overlaying Urban Cityscape
Premium
Blue growth graph business chart data diagram on success financial presentation background
Stagflation Displayed with Financial Data Analysis Background
Dynamic Stock Market Graphs and Financial Data Visualization
Dynamic Financial Graph on Digital Background
Data Processing Visualization with Code and Graphs
Premium
Abstract financial stock market graph with candlestick bars isolated on transparent background
Digital Financial Data Visualization on Grid Display
Digital Stock Market Green Graph Against Dark Trading Board
Digital Financial Data Processing with Graphs and Charts
Dynamic Analysis of Stock Market Trends and Patterns
Premium
Large screen display showing various business graphs and charts.
Graphical Data Analysis on Digital Interface
Futuristic Financial Data Analysis with Rising White Line Graph
Dynamic Financial Data Graphs with Holographic Styles
Global Financial Data Visualization with Digital Overlays
Premium
Stock market graph with blue technology background, financial trading analysis chart, investment growth data visualization, economic business concept
Soundwave Visualization and Data Analysis on Digital Grid
Dynamic Stock Market Analysis Concept Artwork
Financial Growth Chart with Digital Data Interface
Financial Data Analysis with Growing Stock Trends
Premium
Stock market downturn with red candlestick chart, declining line graphs, and trading data screen. Ideal for illustrating financial loss, recession, risk, and economic decline in business visuals.
Fluctuating Stock Market Graph with Dramatic Peaks
Dynamic Financial Data Growth Chart Display
Trend Analysis with Candlestick Chart and Data Indicators
Dynamic Stock Market Graphs Indicating Financial Trends
Dynamic Stock Market Graphs and Tickers Displaying Performance
Dynamic Financial Market Graph Amidst Digital Equations
Premium
Transparent or png stock market investment trading graph growth.Trade business analytics graph and financial chart.
Financial Data Analysis with Growth Trend Arrows on Digital Interface
Financial Data Visualization with Cityscape Overlay
Abstract Financial Market Data Analysis Visualization
Financial Data Flow against Urban Skyline Backdrop
Premium
Financial data charts with glowing stock and forex graphs on a dark background illuminated in blue tones. 3D Rendering
Green Line Rising on Digital Trading Board with Abstract Background
Financial Growth Chart Overlay on City Skyline
Data Security with Tech Bar Graph Overlay
Dynamic Financial Growth Digital Chart Display
Premium
Halloween pumpkins with stock market graph in the background at night
Abstract Financial Data Diagrams Overlapping Sea Waves
Visual Display of Abstract Financial Data
Financial Growth Graph and Data Analytics Representation
Tech-Focused Financial Data Visualization with Rising Graphs
Premium
Green arrow pointing upward on financial graph. Business growth chart with rising trend line. Digital stock market data visualization for investment analysis
Dynamic Financial Graphs and Data Analysis Interface
Inflation Analytics: Graphic Representation of Stock Market Trends
Dynamic Financial Data Graphed Over Digital Grid
Abstract Financial Data Analysis and Stock Market Trends
Premium
Magnifying glass highlights business growth chart with upward trend. Generative AI analysis financial success stock increase profit investment statistic performance market economy improvement
Dynamic Stock Market Data Analysis With Graphs and Percentages
Dynamic Display of Financial Market Data on Advanced Grid
Digital Financial Data Visualization on Dark Screen
Dynamic Stock Market Chart with Fluctuating Trends and Data Points
Premium
Red and yellow financial graph descending against blue background with bokeh lights stock market trading
Digital Graph Showing Financial Fluctuations on Digital Grid Interface
Futuristic Financial Dashboard with Analytics and Data Visualization
Dynamic Digital Stock Market Ticker with Growing Graph Trends
Financial Data Processing in Modern Office Environment
Rising Stock Market Trend with Digital Data Analytics
Financial Data Visualization Over Futuristic Cityscape
Premium
Close-up of computer monitor displaying stock market graphs
Dynamic Financial Graphs Over Cityscape Background
Financial Data Charts with World Map on Blue Digital Background
Dynamic Financial Graphs Illustrating Market Trends
Digital Representation of Inflation with Financial Data Overlay
Premium
Trader checking stock market graph data on screen
Futuristic Stock Market Graph With Digital Overlay
Digital Financial Data Analysis with Graphs and Stock Market Trends
Digital Financial Data Overlay on Urban Street Scene
Dynamic Digital Market Analysis with Holographic Data
Premium
Growth chart business strategy up arrow graph finance stock market or increase money profit diagram on financial concept success economy investment background with digital .
Dynamic Forex Trading Graphs with Increasing Numbers
Financial Graphs with Social Media Analytics on Digital Chart
Dynamic Lines Show Rising Financial Statistics Over Time
Graphical Stock Data Overlapped on Urban Architecture
Premium
Abstract representation of financial growth with glowing graphs and data patterns in dark background
Digital Cityscape with Financial Data Overlay
Data Visualization on Blue Digital Interface
Financial Data Analysis Vibrant Graphs on Blue Background
Digital Financial Data Analytics on Modern Display
Premium
Multiple computer monitors displaying financial charts and graphs in a dimly lit office setting data
Glowing Stock Market Financial Chart Data Overlay
Flowing Digital Data Wave with Grid on Gradient Background
Dynamic Financial Data Analysis with Graph Overlays
Abstract Global Connectivity Diagram With World Map
Premium
A declining red stock market graph with a downward arrow symbolizes a financial crisis and economic recession.
Displaying Candlestick Chart with Trend Lines, Analytics Bubbles and Market Data Overlay