1. Home > 
  2. Stock Photos > 
  3. Advanced Data Visualization on Finance Dashboard

Advanced Data Visualization on Finance Dashboard Image

Advanced Data Visualization on Finance Dashboard

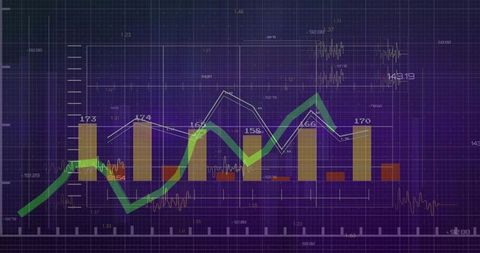
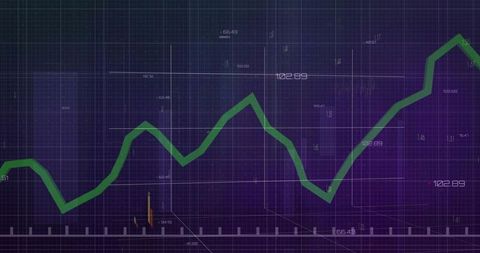
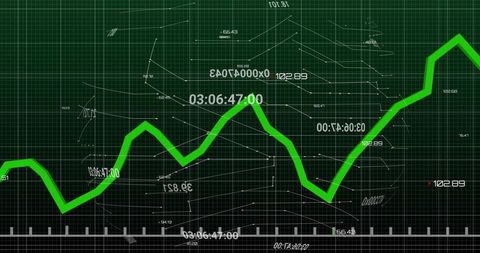
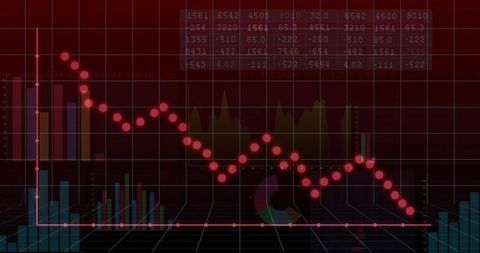
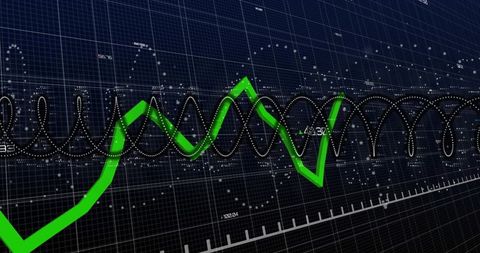
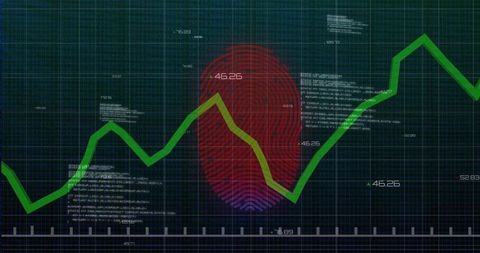
Visualization displays complex financial data using charts and metrics on digital interface. Ideal for articles on finance analytics or dashboard tools development showcasing real-time economic trends and market dynamics for improved business decisions.

Powered by Adobe logo
An analyst uses a computer and dashboard for data business analysis and Data Management System with KPI and metrics connected to the database for technology finance, operations, sales, marketing  - Powered by AdobeMinimalist business dashboard interface with analytics widgets including charts, graphs, and statistics on light grey background. Ai generative. Ai generative - Powered by AdobeRepresentation of data analytics,charts, graphs and data driven insights emerging from a sea of information - Powered by AdobeBusiness finance data analytics graph.Financial management technology.Advisor using KPI Dashboard on virtual screen. - Powered by AdobeForex colorful diagrams and stock market data with lines and dynamics - Powered by Adobe

Credit Photo

If you would like to credit the Photo, here are some ways you can do so

Free (free of charge)

Free for personal and commercial use.

Author: People Creations

Similar Free Stock Images

Green Data Graph on Black Digital Interface
Premium
Tablet with analytics stands before miniature houses representing digital real estate investment.
Financial Data Charts with World Map on Blue Digital Background
Fluctuating Financial Graph on Green Grid Background
Futuristic Neon Green Data Visualization on Grid Background
Dynamic Digital Data Dashboard with Analytics Charts and Graphs
Premium
Businessman works on laptop Showing business analytics dashboard with charts, metrics, and KPI to analyze performance and create insight reports for operations management. Data analysis concept.Ai
Dynamic Financial Graphs Overlaying Modern Cityscape
Green Trend Line on Dark Grid Represents Economic Growth
Digital Green Line Graph Over Grid with Statistics and Numbers
Candlestick Chart Visualization with Indicators and Growth Highlight
Innovative Data Analysis with Dynamic Line Graph and Digital Elements
Premium
Man look at the dashboard with graphs and charts. Concept of data management system, business intelligence, data statistics, marketing analysis, key performance indicators (KPI) and analytics.
Digital Data Analysis with Green Line Graph on Grid Background
Premium
Man analyst uses a computer AI artificial intelligence and dashboard for data business analysis and Data Management System with KPI and metrics connected to the database for technology finance
Fluctuating Line Graph on Analytics Dashboard
Candlestick trading chart displaying trend lines, indicators and percentage labels
Digital Financial Analytics with Red Trends on Grid Screen
Dynamic Red Line Graph With Data Points on Gridded Background
Premium
Hands holding glowing geometric shapes and orange data bars, conveying innovation, digital analytics, technology and insight in dark minimalist setting
Green Line Graph Overlapping Data Server Racks in Technology Center
Dynamic Financial Stock Market Analysis Display
Dynamic Data Visualization with Financial Charts and 3D Elements
Rising Digital Graph and Data Visualizations on Black Background
Red Line Graph Displaying Complex Digital Trend Analysis
Dynamic Financial Graph with Candlestick Patterns and Percentage Metrics
Digital Currency Trading Interface with Data Visualization
Visualizing market volatility on navy gradient with magenta and blue trend lines, copy space
Premium
Businessman using laptop analyzing dashboard performance indicators business growth charts and economic growth, business finance and investment decisions, market research and strategic planning.
Digital Data Processing Interface with Green Growth Chart
Green Data Line Sweeping Across Futuristic Dashboard Grid Showing Analytics Trend and Telemetry
Fluctuating Stock Market Graph with Dramatic Peaks
Complex Financial Data Analysis on Purple Grid Background
Premium
A person monitors multiple screens displaying global data, analytics, and maps in a high-tech control room, focused on real-time information and digital security.
Dynamic Lines Show Rising Financial Statistics Over Time
Digital Financial Data with Graph and Grid Patterns
Digital Finance: Modern Stock Market Analysis Display
Analyzing Stock Market Trends with Candlestick Chart and Data Visualization
Premium
Business Leader Presenting Data Analytics in Modern Boardroom Meeting
Financial Data Analysis on Blue Digital Interface
Futuristic Data Visualization with Dynamic Graphs and Digital Globe
Rising Financial Data Graph on Digital Grid Background
Advanced Digital Dashboard with Rising Bar and Line Charts
Green Line Chart on 3D Digital Graph for Financial Analysis
Abstract Digital Data Graph and Diagrams on Gray Background
Rising Graphs and Interactive Financial Data Analytics Background
Analyzing Financial Data on Digital World Map Background
Financial Dashboard with Data Visualization and Social Interaction Metrics
Dynamic Financial Graphs Illustrating Market Trends
Dynamic Financial Data Visualization with Binary Code Overlay
Digital Financial Data and Global Market Analysis on Graph
Financial Data Line Graph on Digital Display
Premium
Manager touches growth graph on analytics dashboard. Business data analysis reports with marketing finance management strategy. Digital charts graphs increase business performance, sales statistic
Premium
campaign, roas, ads, spend, return, clicks, Hands typing on laptop with digital campaign analytics dashboard showing ROAS, ad spend, clicks, impressions, and performance report for online marketing.
Data Analysis Graphics on Digital Grid Background
Futuristic Keyboard Analytics Display with Digital Graphs and Numbers
Real-Time Financial Data Analysis with Graphs and Charts
Green Fluctuating Line Graph on Digital Grid for Financial Analysis
Premium
Vibrant workspace showcasing data analysis with colorful charts and graphs on a large digital dashboard display
Colorful Financial Data Charts on Digital Grid Background
Dynamic Financial Data Overlaid on Grid Background
Financial Growth Stock Nikkei in Urban City Skyline
Dynamic Financial Growth Digital Chart Display
Futuristic green analytics dashboard displaying jagged trend line on gridded interface
World Map with Falling Line Graphs Indicating Global Economic Decline
Digital Financial Chart with Green Trend Line on Grid Background
Digital Data Visualization with Trend Lines and Percentage Changes
Digital Stock Market Green Graph Against Dark Trading Board
Abstract Digital Data with Upward Trending Line Graph
Tracking rising market trend with bold green line on futuristic trading dashboard display
Economic Trends Analysis with Financial Indicators and Graphs
Red Downtrend Line Falling Across Digital Financial Dashboard With Teal Indicator Dots
Red Line Chart Trending Downward in Data Visualization
Premium
Analyst computer working with information database to analysis marketing sale data. Business project or program strategy planning and development for corporate operating finance and investment concept
Cityscape with Digital Stock Market Graphs and Statistics
Financial Growth Illustrated with Bar Charts and Upward Arrow
Rising Graph Line on Digital Green Grid Background
Financial dashboard showing descending red trend line over 3D grid with teal bars, data
Green Line Graph on Dark Digital Grid
Thick red trend line declining across dashboard grid with green markers and labels
Premium
An analyst uses a computer and dashboard for data business analysis and Data Management System with KPI and metrics connected to the database for technology finance, operations, sales, marketing
Dynamic Green Line Graph Depicting Financial Data
Dynamic Data Dashboard with Multicolored Trendlines and Chart Bars
Neon Social Media Analytics Line Chart with Engagement Bubbles Showing Likes Comments
Holographic Financial Data Visualization with Stock Trends
Premium
Futuristic business intelligence dashboard interface with financial data visualization for
Premium
A laptop displays colorful bar charts and graphs, with printed analytics reports on a desk in a bright office setting.
Financial Data Analysis in Digital Interface with Graphs
Financial Growth Graph and Data Analytics Representation
Rising Financial Graph on Purple Background
Dynamic Digital Stock Market Analysis Chart Visual
Premium
Businessman analyze and visualize complex information on a virtual screen using AI to process data. Big data technology and data science.Data flow.Digital neural network.artificial intelligence
Data Analysis Process with Green Digital Interface
Dynamic Financial Data Visualization on Digital Grid Background
Rising Green Line Chart Overlays Concept of Financial Growth
Dynamic Forex Trading Graphs with Increasing Numbers
Premium
Futuristic digital dashboard displays business growth metrics. Data visualization shows product lifecycle, market launch, end-of-life performance. Technology concept with chart graphs, cyber space
Premium
A hand interacting with a futuristic dashboard display showing colorful graphs and charts during a Christmas and Happy New Year celebration with a dark background.
Financial Data Visualization with Colorful Graphs and Charts Representing Analytics
Abstract Digital Financial Data Chart with Pink Line Oscillations
Digital Financial Data Graph Showcasing Market Trends
Premium
Two businesspeople or an accountant team are analyzing data charts, graphs, and a dashboard on a laptop screen in order to prepare a statistical report and discuss financial data in an office.
Premium
two founders reviewing charts and laptop over coffee, analytical discussion with printouts and notes, planning
Dynamic Financial Data Chart Showing Trend Analysis
Financial Growth Chart with Data Visualization Elements
Dynamic Line Chart Representing Financial Data Growth
Premium
Modern business team analyzing data on a large digital screen with holographic charts and virtual interface. Concept of artificial intelligence, analytics, innovation, teamwork, cybersecurity,
Abstract Financial Data Processing and Analysis Interface
Financial Data Analysis with Interactive Graphs
Premium
Data analytics and big data strategy for real-time analytics, predictive data modeling, business intelligence analytics, and data-driven decision-making in modern digital businesses. Thunk
Premium
A business professional engages with a tablet, analyzing financial data presented through interactive charts and graphs, enhancing strategic insights for decision making. Scalp
Fluctuating Digital Stock Market Data Chart
Dynamic Financial Data Visualization over Urban Silhouette
Green Line Graph with Data Points on Grid Background
NFT Financial Data Visualization with Digital Graph Overlay
Green Line Chart on Dark Grid Interface with Sine Wave Data
Financial Graph Analysis on Green Grid Background
Green Line Rising on Digital Trading Board with Abstract Background
Overlaying fingerprint analytics with rising green line chart on dark grid cyber dashboard
Premium
Businessperson analyzing data on a digital tablet.
Financial Graph and Cityscape Analysis with Technological Overlay
Economic and Political Factors Influence Investment Trends
Fluctuating Line Chart on Analytics Dashboard Interface
Futuristic Graph and Data Visualization Interface Design
Premium
business statistics info graphics, pie charts, bar graphs, and numerical data, business growth analysis
Explore More Free Stock Images