
- Home >
- Stock Photos >
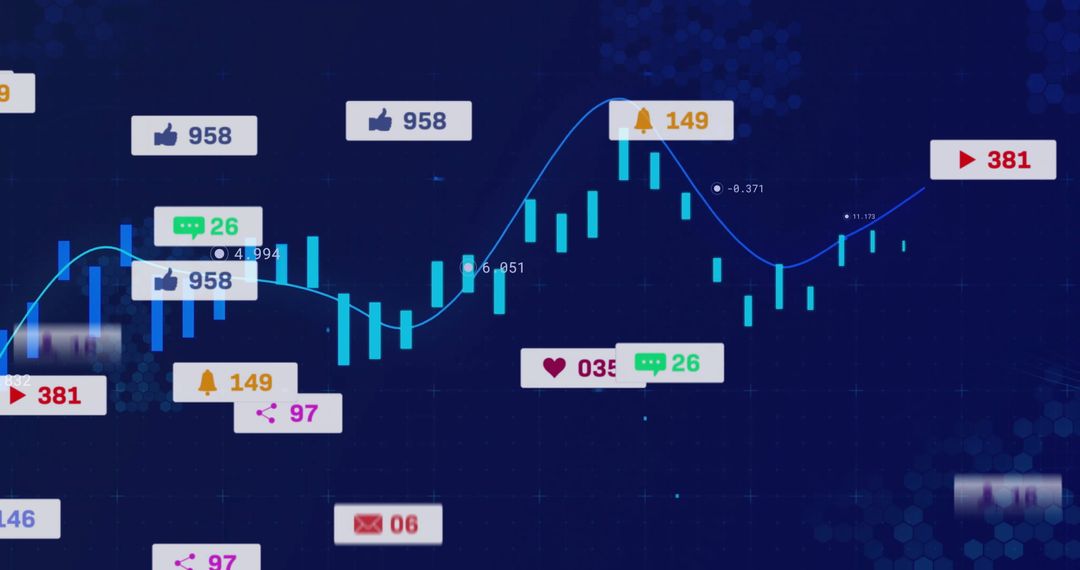
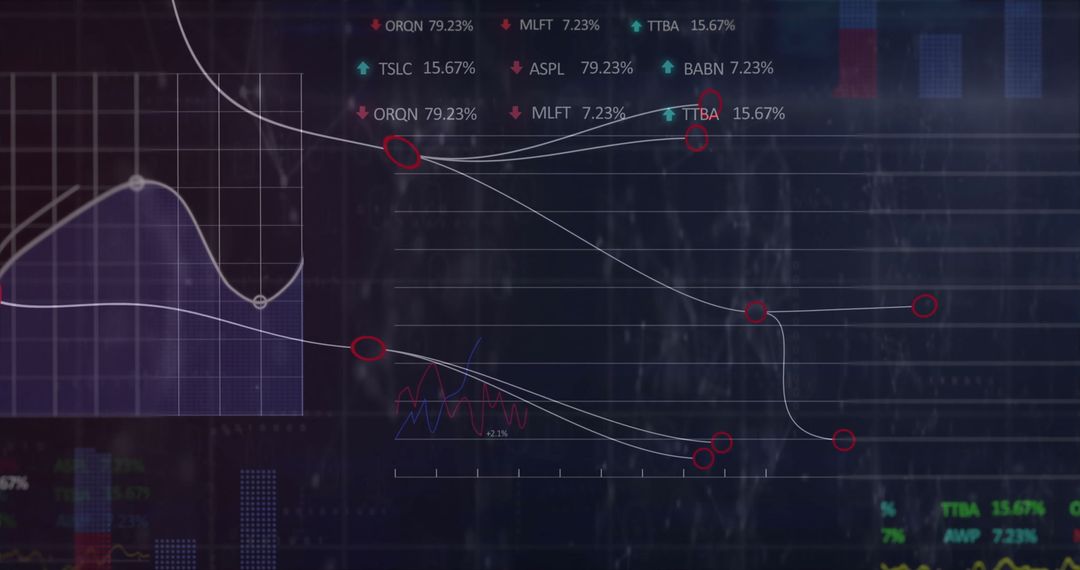
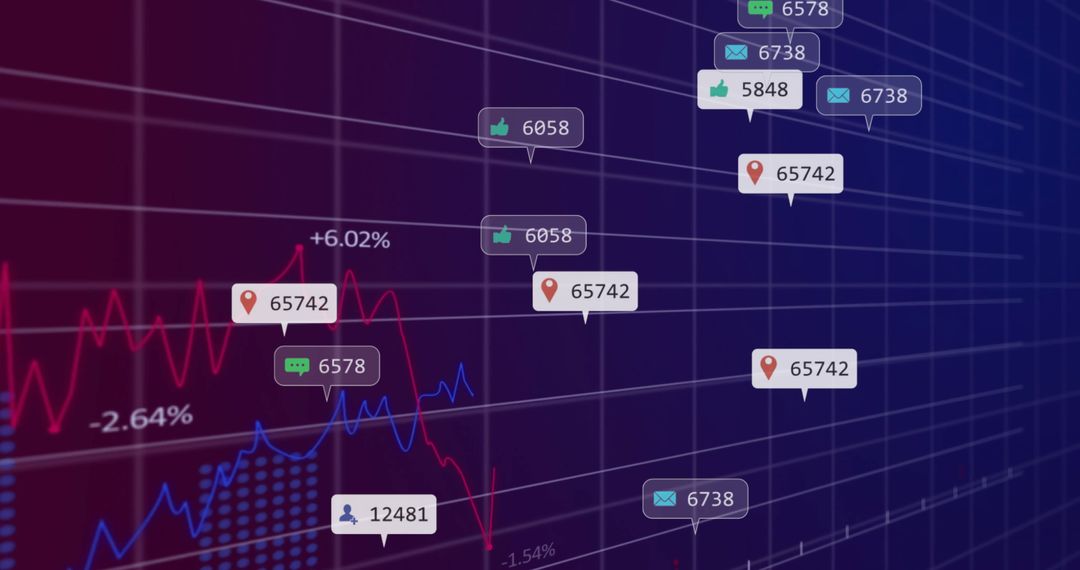
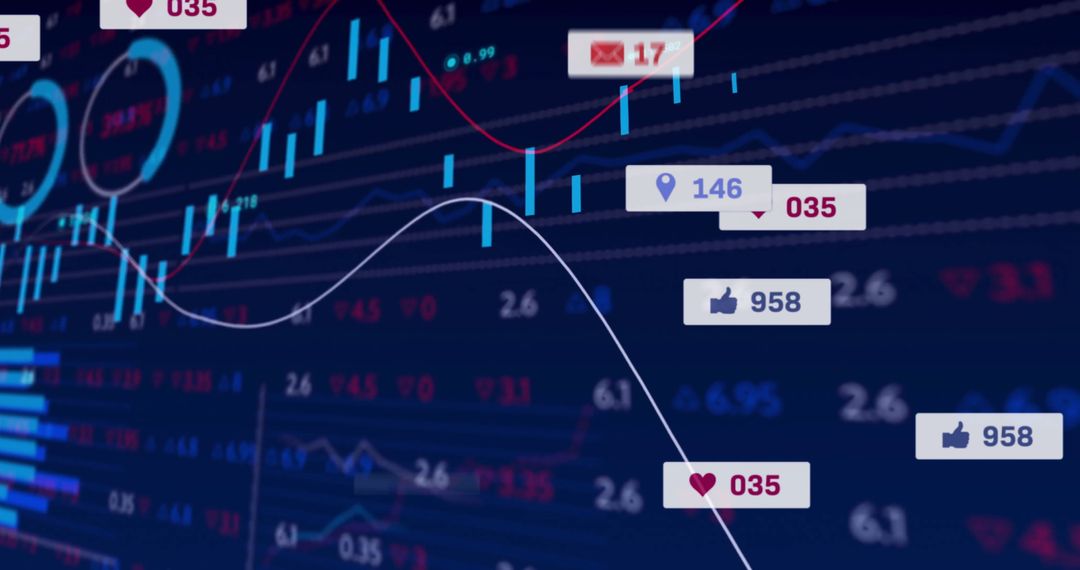
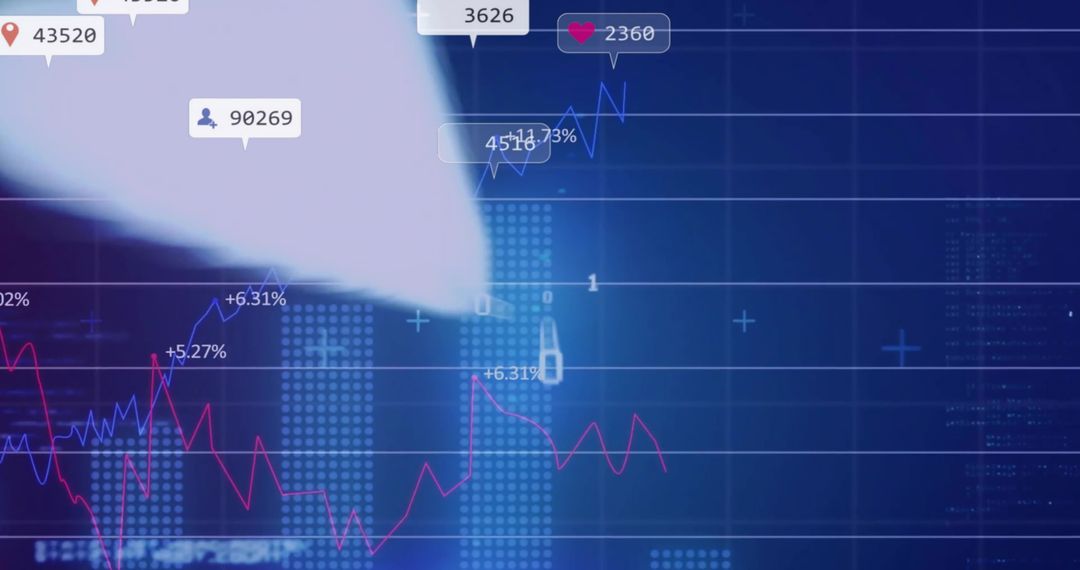
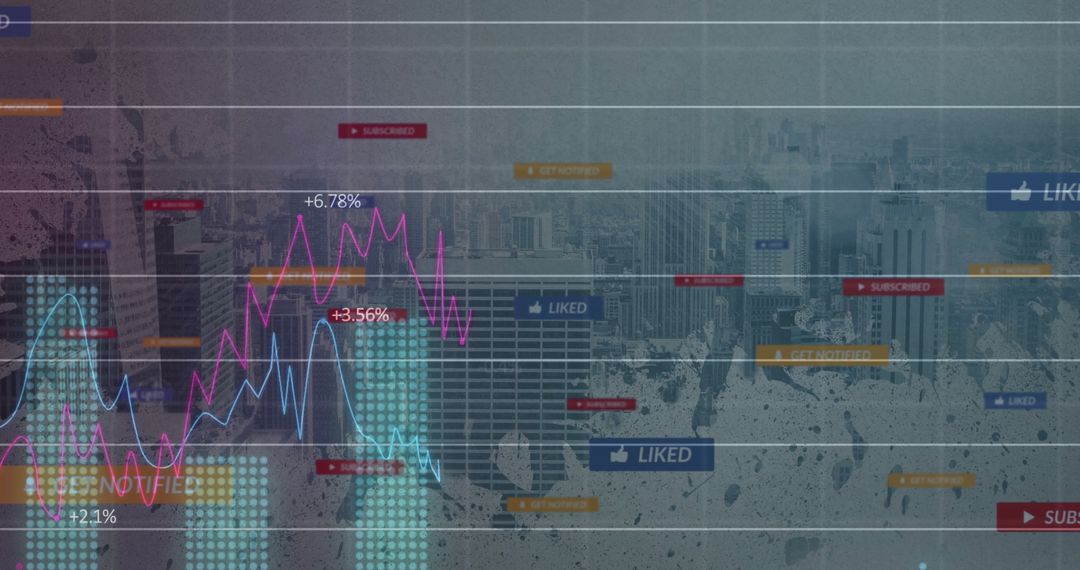
- Analytical Dashboard with Social Media Metrics and Line Charts
Analytical Dashboard with Social Media Metrics and Line Charts Image

The visual dynamically combines elements of data analytics, with line charts showing fluctuations in trends likely associated with social media interactions or financial shifts. This is enhanced with icons representing social favorites like likes and comments, adding layers of strategy influenced by user engagement metrics. Useful for financial presentations, articles on social media trends, or businesses explaining digital outreach impact.
Powered by  - Get 15% off with code: PIKWIZARD15


0
downloads
downloads
Tags:
More
Credit Photo
If you would like to credit the Photo, here are some ways you can do so
Text Link
photo Link
<span class="text-link">
<span>
<a target="_blank" href=https://pikwizard.com/photo/analytical-dashboard-with-social-media-metrics-and-line-charts/d6aae4e88402447a6db504bd6a84cc5f/>PikWizard</a>
</span>
</span>
<span class="image-link">
<span
style="margin: 0 0 20px 0; display: inline-block; vertical-align: middle; width: 100%;"
>
<a
target="_blank"
href="https://pikwizard.com/photo/analytical-dashboard-with-social-media-metrics-and-line-charts/d6aae4e88402447a6db504bd6a84cc5f/"
style="text-decoration: none; font-size: 10px; margin: 0;"
>
<img src="https://pikwizard.com/pw/medium/d6aae4e88402447a6db504bd6a84cc5f.jpg" style="margin: 0; width: 100%;" alt="" />
<p style="font-size: 12px; margin: 0;">PikWizard</p>
</a>
</span>
</span>
Free (free of charge)
Free for personal and commercial use.
Author: People Creations
Similar Free Stock Images

Premium


Premium


Premium


Premium


Premium


Premium


Premium


Premium


Premium


Premium


Premium


Premium


Premium


Premium


Premium


Premium


Premium


Premium


Premium


Premium


Premium


Premium


Premium


Premium

