
- Home >
- Free Stock Photos & Images >
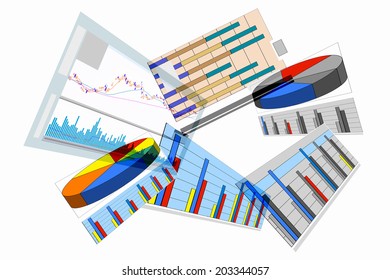
- Dynamic Data Dashboard with Analytics Chart Graphics
Dynamic Data Dashboard with Analytics Chart Graphics Free Stock Image

This visualization displaying a complex interface includes elements such as a multi-color line graph and interactive metric widgets against a dark grid. Useful for business analytics software presentations, digital marketing platforms, and reports focusing on data engagement and user statistics. With its bright icons and mixed visuals, it is also ideal for illustrating technology trends in data analysis and interactive dashboard capabilities.
Powered by  - Get 15% off with code: PIKWIZARD15


downloads
Tags:
More
Credit Photo
If you would like to credit the Photo, here are some ways you can do so
Text Link
photo Link
<span class="text-link">
<span>
<a target="_blank" href=https://pikwizard.com/photo/dynamic-data-dashboard-with-analytics-chart-graphics/0a903c705985b9013a35f2e47063fa66/>PikWizard</a>
</span>
</span>
<span class="image-link">
<span
style="margin: 0 0 20px 0; display: inline-block; vertical-align: middle; width: 100%;"
>
<a
target="_blank"
href="https://pikwizard.com/photo/dynamic-data-dashboard-with-analytics-chart-graphics/0a903c705985b9013a35f2e47063fa66/"
style="text-decoration: none; font-size: 10px; margin: 0;"
>
<img src="https://thumbs.wbm.im/pw/medium/0a903c705985b9013a35f2e47063fa66.jpg" style="margin: 0; width: 100%;" alt="Dynamic Data Dashboard with Analytics Chart Graphics" />
<p style="font-size: 12px; margin: 0;">PikWizard</p>
</a>
</span>
</span>
Free (free of charge)
Free for personal and commercial use.
Author: Authentic Images
Similar Free Stock Images


Premium


Premium


Premium


Premium


Premium


Premium


Premium


Premium


Premium


Premium


Premium


Premium


Premium


Premium


Premium


Premium


Premium


Premium


Premium


Premium


Premium


Premium


Premium


Premium


Premium

Explore More Free Stock Images