
- Home >
- Stock Photos >
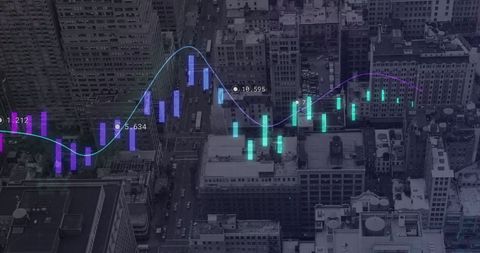
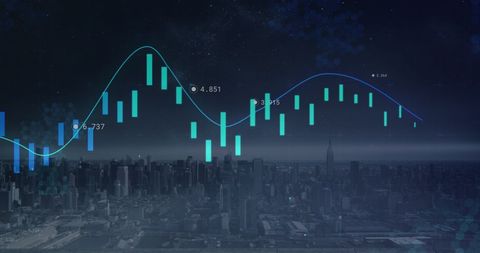
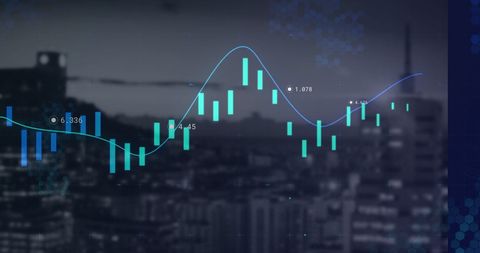
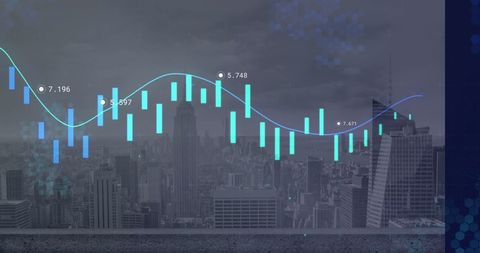
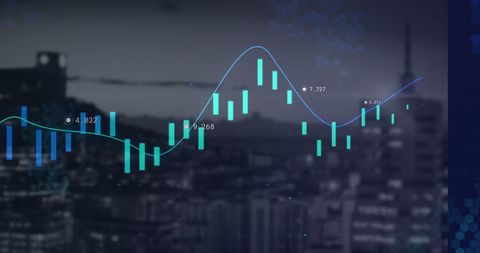
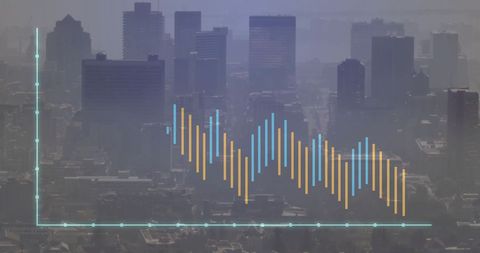
- Analyzing Data Trends with Futuristic Graph Interface
Analyzing Data Trends with Futuristic Graph Interface Image

Visualization of data analytics with a futuristic graph interface showcases an analysis of global business trends. Vibrant paths and glowing points emphasize financial performance metrics, useful for presentations, reports, or articles on technology and business growth.
Powered by 


downloads
Tags:
More
Credit Photo
If you would like to credit the Photo, here are some ways you can do so
Text Link
photo Link
<span class="text-link">
<span>
<a target="_blank" href=https://pikwizard.com/photo/analyzing-data-trends-with-futuristic-graph-interface/2f7f3a3a2ce466d07d2cb8c64473b271/>PikWizard</a>
</span>
</span>
<span class="image-link">
<span
style="margin: 0 0 20px 0; display: inline-block; vertical-align: middle; width: 100%;"
>
<a
target="_blank"
href="https://pikwizard.com/photo/analyzing-data-trends-with-futuristic-graph-interface/2f7f3a3a2ce466d07d2cb8c64473b271/"
style="text-decoration: none; font-size: 10px; margin: 0;"
>
<img src="https://pikwizard.com/pw/medium/2f7f3a3a2ce466d07d2cb8c64473b271.jpg" style="margin: 0; width: 100%;" alt="" />
<p style="font-size: 12px; margin: 0;">PikWizard</p>
</a>
</span>
</span>
Free (free of charge)
Free for personal and commercial use.
Author: Authentic Images
Similar Free Stock Images

Premium


Premium

Premium


Premium


Premium

Premium

Premium


Premium


Premium

Premium


Premium

Premium

Premium


Premium


Premium


Premium


Premium


Premium


Premium


Premium


Premium


Premium

Premium
Premium


Premium


Explore More Free Stock Images