
- Home >
- Stock Photos >
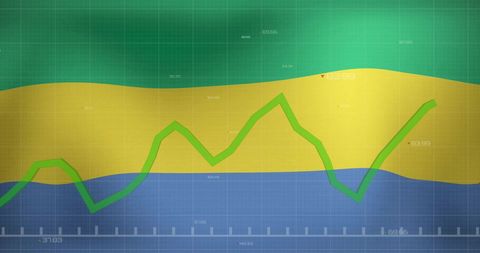
- Analyzing Growing Graph Line on Purple Gradient Background
Analyzing Growing Graph Line on Purple Gradient Background Image

Sharp green line iconically indicates growth against saturated purple background. Techniques as storytelling reminiscent of traders. Data representation for business metrics detailed within virtual analytics investigation. Passport any potential risk failures through diligent monitoring measures available system built purposefunctions foundation. Useful for finance reports, technology presentations, and data-driven projections. Ideal for tech industry collateral or business financial analysis discussions.
Powered by 


downloads
Tags:
More
Credit Photo
If you would like to credit the Photo, here are some ways you can do so
Text Link
photo Link
<span class="text-link">
<span>
<a target="_blank" href=https://pikwizard.com/photo/analyzing-growing-graph-line-on-purple-gradient-background/bde0cfcfa57d7165df6a2203f8a5957c/>PikWizard</a>
</span>
</span>
<span class="image-link">
<span
style="margin: 0 0 20px 0; display: inline-block; vertical-align: middle; width: 100%;"
>
<a
target="_blank"
href="https://pikwizard.com/photo/analyzing-growing-graph-line-on-purple-gradient-background/bde0cfcfa57d7165df6a2203f8a5957c/"
style="text-decoration: none; font-size: 10px; margin: 0;"
>
<img src="https://pikwizard.com/pw/medium/bde0cfcfa57d7165df6a2203f8a5957c.jpg" style="margin: 0; width: 100%;" alt="" />
<p style="font-size: 12px; margin: 0;">PikWizard</p>
</a>
</span>
</span>
Free (free of charge)
Free for personal and commercial use.
Author: Awesome Content
Similar Free Stock Images

Premium


Premium


Premium


Premium


Premium


Premium


Premium


Premium


Premium


Premium


Premium


Premium

Premium

Premium


Premium


Premium


Premium


Premium


Premium


Premium


Premium


Premium


Premium

Premium


Premium


Explore More Free Stock Images