- Home >
- Stock Photos >
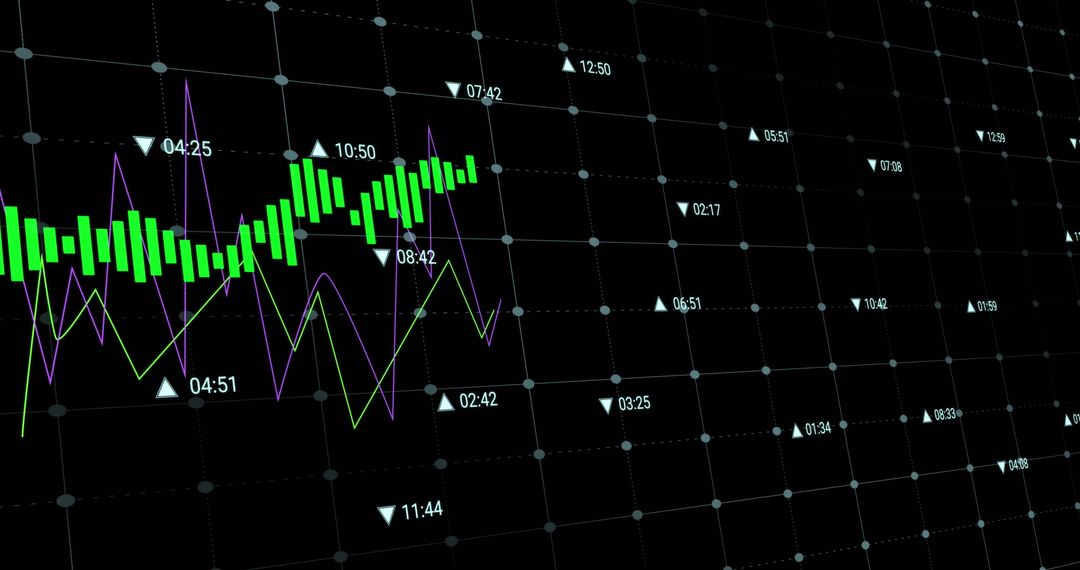
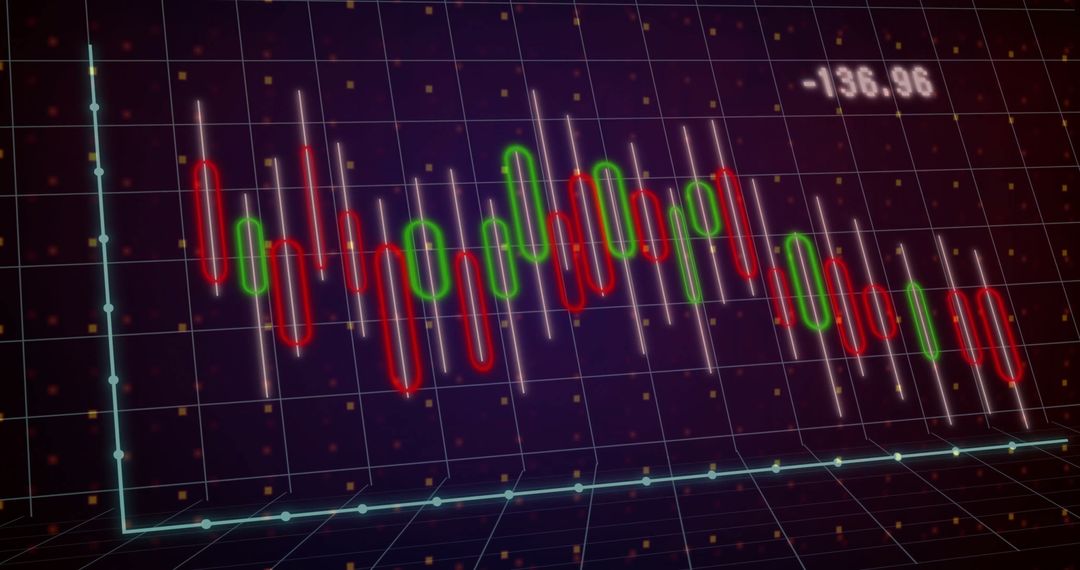
- Animating Neon 3D Candlestick Trading Chart on Virtual Grid with Glowing Code Overlay
Animating Neon 3D Candlestick Trading Chart on Virtual Grid with Glowing Code Overlay Image

Showing neon green and red candlestick bars with thin wicks floating above glowing turquoise 3D grid. Overlaying translucent programming code and numeric readout 53.26 for tech-driven feel. Featuring smooth turquoise line tracking price trend across grid and subtle motion blur for dynamic effect. Suggesting high-tech trading dashboard, algorithmic analysis, and real-time market data. Providing versatile composition for hero banners, website headers, blog posts, social media ads, presentation slides, video intros, or app backgrounds. Emphasizing contrast with dark background for headline overlays and UI elements. Allowing easy cropping for wide or square layouts and leaving negative space for text or branding.
Powered by 


0
downloads
downloads
Tags:
More
Credit Photo
If you would like to credit the Photo, here are some ways you can do so
Text Link
photo Link
<span class="text-link">
<span>
<a target="_blank" href=https://pikwizard.com/photo/animating-neon-3d-candlestick-trading-chart-on-virtual-grid-with-glowing-code-overlay/c6591bd1cd6fbca53031379a9701f887/>PikWizard</a>
</span>
</span>
<span class="image-link">
<span
style="margin: 0 0 20px 0; display: inline-block; vertical-align: middle; width: 100%;"
>
<a
target="_blank"
href="https://pikwizard.com/photo/animating-neon-3d-candlestick-trading-chart-on-virtual-grid-with-glowing-code-overlay/c6591bd1cd6fbca53031379a9701f887/"
style="text-decoration: none; font-size: 10px; margin: 0;"
>
<img src="https://pikwizard.com/pw/medium/c6591bd1cd6fbca53031379a9701f887.jpg" style="margin: 0; width: 100%;" alt="" />
<p style="font-size: 12px; margin: 0;">PikWizard</p>
</a>
</span>
</span>
Free (free of charge)
Free for personal and commercial use.
Author: Authentic Images
Similar Free Stock Images

Premium


Premium


Premium


Premium


Premium


Premium


Premium


Premium


Premium


Premium


Premium


Premium


Premium


Premium


Premium


Premium


Premium


Premium


Premium


Premium


Premium


Premium


Premium


Premium