- Home >
- Stock Photos >
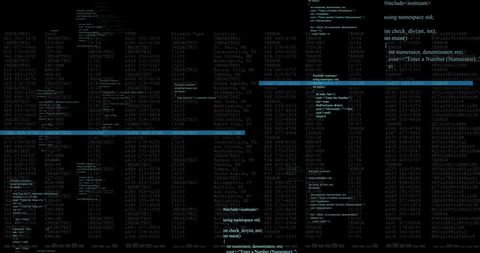
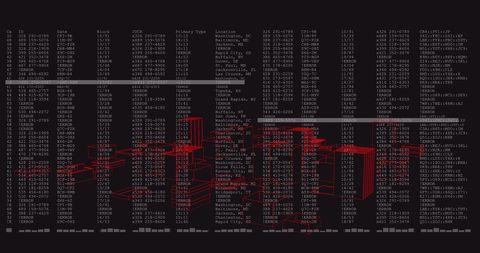
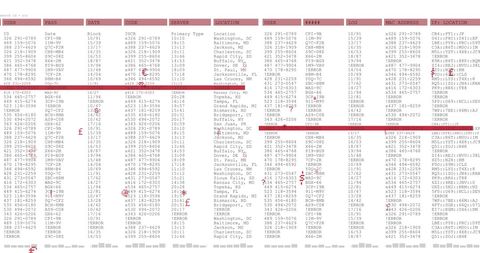
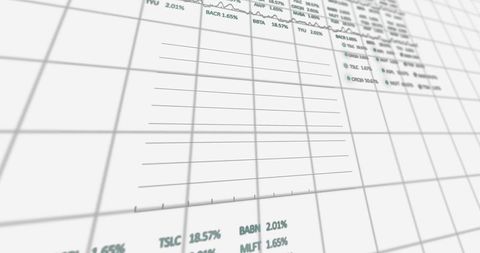
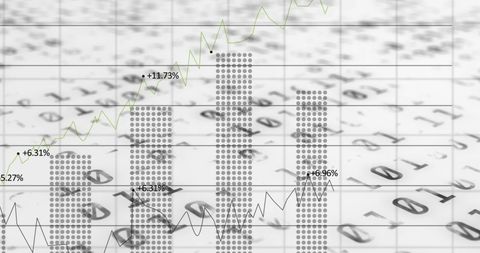
- Binary Code Over Financial Data with Rising Graph
Binary Code Over Financial Data with Rising Graph Image
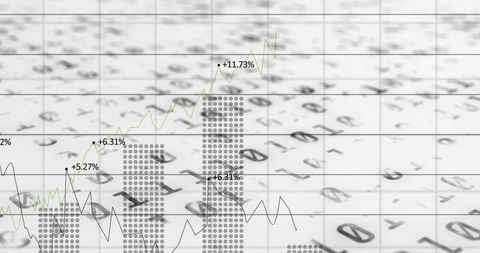
Busy financial backdrop with binary code overlay showing financial data analysis concept. A rising graph depicting growth alongside visible percentages enhances the theme of global business and technology integration. Useful for illustrating topics related to market analysis, economic forecasts, digital finances, and business intelligence presentations.

downloads
Tags:
More
Credit Photo
If you would like to credit the Photo, here are some ways you can do so
Text Link
photo Link
<span class="text-link">
<span>
<a target="_blank" href=https://pikwizard.com/photo/binary-code-over-financial-data-with-rising-graph/702e95b8859101e0f5e46269475411f4/>PikWizard</a>
</span>
</span>
<span class="image-link">
<span
style="margin: 0 0 20px 0; display: inline-block; vertical-align: middle; width: 100%;"
>
<a
target="_blank"
href="https://pikwizard.com/photo/binary-code-over-financial-data-with-rising-graph/702e95b8859101e0f5e46269475411f4/"
style="text-decoration: none; font-size: 10px; margin: 0;"
>
<img src="https://pikwizard.com/pw/medium/702e95b8859101e0f5e46269475411f4.jpg" style="margin: 0; width: 100%;" alt="" />
<p style="font-size: 12px; margin: 0;">PikWizard</p>
</a>
</span>
</span>
Free (free of charge)
Free for personal and commercial use.
Author: Authentic Images