
- Home >
- Free Stock Photos & Images >
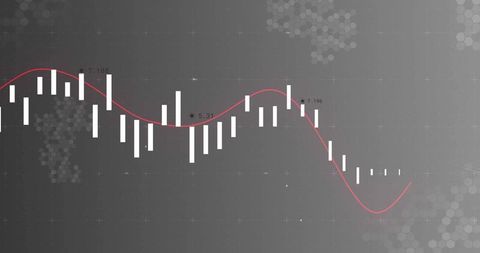
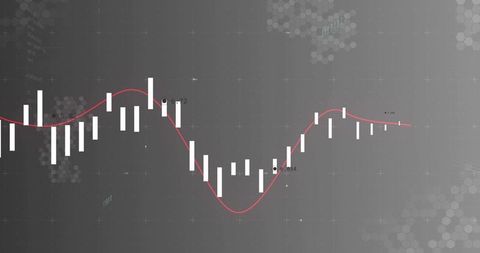
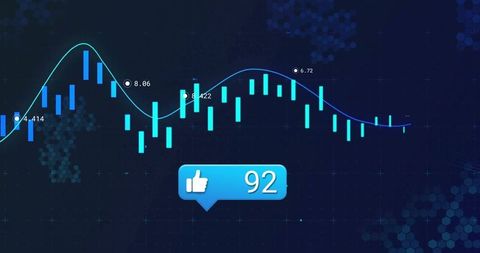
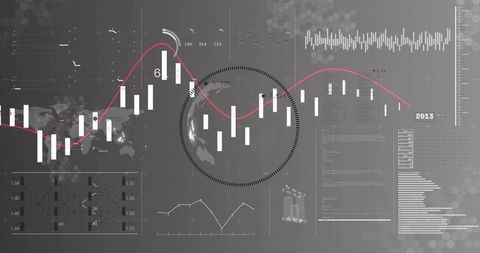
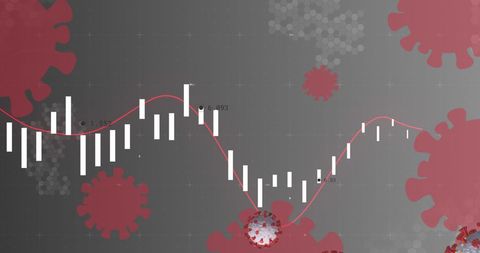
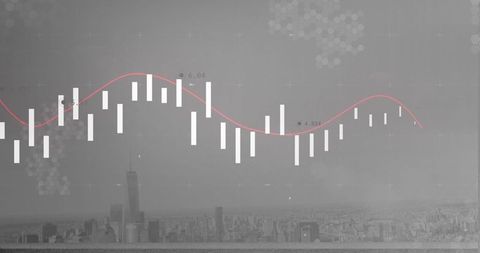
- Binary Market Data Visualization with Candlestick Bars and Red Trend Line in Grayscale
Binary Market Data Visualization with Candlestick Bars and Red Trend Line in Grayscale Free Stock Image

Showing candlestick bars and red trend line layered over streaming binary code, creating high-tech financial data aesthetic with grayscale palette and subtle hexagon pattern. Featuring upward trend movement and suiting concepts like market recovery, trading signals, predictive analytics and algorithmic strategies. Suiting fintech websites, trading platform interfaces, financial reports, investor presentations, blog headers, social media posts and marketing for investment technology. Helping illustrate topics such as stock market analysis, big data in finance, machine learning models and cybersecurity for trading systems. Allowing cropping for hero banners or scaling for print and digital layouts while maintaining clarity and visual impact.
Powered by  - Get 15% off with code: PIKWIZARD15


downloads
Tags:
More
Credit Photo
If you would like to credit the Photo, here are some ways you can do so
Text Link
photo Link
<span class="text-link">
<span>
<a target="_blank" href=https://pikwizard.com/photo/binary-market-data-visualization-with-candlestick-bars-and-red-trend-line-in-grayscale/95b1fcc204aa42cdcf58b0de74d02cf5/>PikWizard</a>
</span>
</span>
<span class="image-link">
<span
style="margin: 0 0 20px 0; display: inline-block; vertical-align: middle; width: 100%;"
>
<a
target="_blank"
href="https://pikwizard.com/photo/binary-market-data-visualization-with-candlestick-bars-and-red-trend-line-in-grayscale/95b1fcc204aa42cdcf58b0de74d02cf5/"
style="text-decoration: none; font-size: 10px; margin: 0;"
>
<img src="https://thumbs.wbm.im/pw/medium/95b1fcc204aa42cdcf58b0de74d02cf5.jpg" style="margin: 0; width: 100%;" alt="Binary Market Data Visualization with Candlestick Bars and Red Trend Line in Grayscale" />
<p style="font-size: 12px; margin: 0;">PikWizard</p>
</a>
</span>
</span>
Free (free of charge)
Free for personal and commercial use.
Author: People Creations
Similar Free Stock Images


AI

Premium


Premium


Premium


Premium


Premium


Premium


Premium


Premium


Premium


Premium


Premium


Premium


AI


Premium


Premium


Premium


Premium


Premium


Premium


Premium


Premium


Premium


Premium


Premium


Premium


Premium

Explore More Free Stock Images