
- Home >
- Stock Photos >
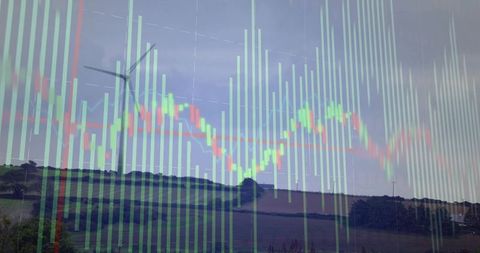
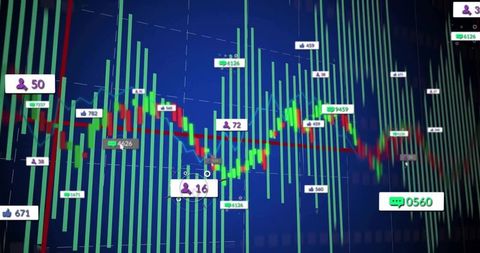
- Bitcoin on Dynamic Financial Data Graph Chart
Bitcoin on Dynamic Financial Data Graph Chart Image

Use to illustrate shifting cryptocurrency markets, analyzing data performance, financial reports. Ideal for articles on digital currency trends, predictive analytics, economic strategies. Suitable for presentations in business or technology sectors.
Powered by  - Get 15% off with code: PIKWIZARD15


downloads
Tags:
More
Credit Photo
If you would like to credit the Photo, here are some ways you can do so
Text Link
photo Link
<span class="text-link">
<span>
<a target="_blank" href=https://pikwizard.com/photo/bitcoin-on-dynamic-financial-data-graph-chart/abf0ef5ddcff0ddf0b7e4cc76ad2be7c/>PikWizard</a>
</span>
</span>
<span class="image-link">
<span
style="margin: 0 0 20px 0; display: inline-block; vertical-align: middle; width: 100%;"
>
<a
target="_blank"
href="https://pikwizard.com/photo/bitcoin-on-dynamic-financial-data-graph-chart/abf0ef5ddcff0ddf0b7e4cc76ad2be7c/"
style="text-decoration: none; font-size: 10px; margin: 0;"
>
<img src="https://pikwizard.com/pw/medium/abf0ef5ddcff0ddf0b7e4cc76ad2be7c.jpg" style="margin: 0; width: 100%;" alt="" />
<p style="font-size: 12px; margin: 0;">PikWizard</p>
</a>
</span>
</span>
Free (free of charge)
Free for personal and commercial use.
Author: People Creations
Similar Free Stock Images

Premium


Premium

Premium

Premium


Premium

Premium


Premium

Premium

Premium


Premium


Premium


Premium


Premium


Premium


Premium


Premium

Premium


Premium

Premium


Premium


Premium


Premium


Premium


Premium

Premium

Explore More Free Stock Images