1. Home > 
  2. Stock Photos > 
  3. Businessman Analyzing Decreasing Financial Chart Trends

Businessman Analyzing Decreasing Financial Chart Trends Image

Businessman Analyzing Decreasing Financial Chart Trends

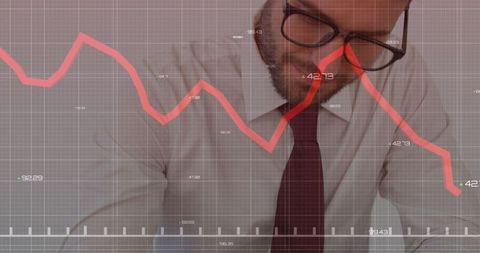
Seen through overlay, businessman studies declining graph which symbolizes stock market trends. Useful for illustrating concepts of market fluctuation, financial instability, crisis management, or economic analysis in articles, reports, or blog posts related to finance and economy.

Powered by Shutterstock logo - Get 15% off with code: PIKWIZARD15
businessman hand working with new modern computer and business strategy as concept - Powered by Shutterstock - Get 15% off with code: PIKWIZARD15Banking business, finance and investment concept. Businessman analyzing market data, financial graph report, economic growth, business strategy, planning and solution, risk management - Powered by Shutterstock - Get 15% off with code: PIKWIZARD15Two diverse crypto traders brokers stock exchange market investors discussing trading charts research reports growth using pc computer looking at screen analyzing invest strategy, financial risks. - Powered by Shutterstock - Get 15% off with code: PIKWIZARD15Analysis finance grow graph and market  investment. Financial  business plan,earnings,sale and strategy. Stock market chart, exchange financial growth diagram. - Powered by Shutterstock - Get 15% off with code: PIKWIZARD15Business analysis, trading concept, Businessman, finance analyst using digital tablet, analyzing financial graph, stock market report, economic graph growth chart, business and technology background - Powered by Shutterstock - Get 15% off with code: PIKWIZARD15

Credit Photo

If you would like to credit the Photo, here are some ways you can do so

Free (free of charge)

Free for personal and commercial use.

Author: People Creations

Similar Free Stock Images

Loading...
Dynamic Financial Data Display in Digital Space
Premium
Financial Expert Reviews Market Projections and Investment Strategies on Computer
Financial Data Flow against Urban Skyline Backdrop
Premium
Business man holding tablet and showing holographic graphs and stock market statistics gain profits. Concept of growth planning and business strategy. Display of good economy form digital screen.
Innovative Data Analysis with Dynamic Line Graph and Digital Elements
Business Professionals Analyzing Data on Electronic Tablet
Diverse Women Analyzing Data on Digital Interface
Premium
Financial Analysts and Day Traders Working on a Computers with Multi-Monitor Workstations with Real-Time Stocks, Commodities and Exchange Market Charts. Team of Brokers at Work in Agency.
Premium
Financial advisor explaining invest stock market data consulting investor. Two busy business men analysts doing finance trading analysis pointing at exchange chart on laptop screen working in office.
Premium
Businessman analyzing forex trading graph financial data. Stock Market Investments Funds and Digital Assets. Business finance technology and investment concept. Business finance background.
Senior Businessman Discussing Financial Growth Trends
Diverse Female Colleagues Analyzing Market Trends on Laptop
Futuristic Stock Market Graph With Digital Overlay
Premium
Stock market analysis, notebooks, laptops,ai creates images
Growth Trend with Green Line Overlay and Modern Cityscape
Green Financial Line Chart Over Modern Office Buildings
Financial Graphs Displaying Business Trends on Grid Background
Businesswomen Analyzing Growth Trends with Digital Overlay
Colleagues Analyzing Financial Data on Digital Grid Interface
Premium
Financial Analyst Working on Computer with Multi-Monitor Workstation with Real-Time Stocks, Commodities and Exchange Market Charts. African American Trader Works in Investment Bank Late at Night.
Financial Graphs Overlay Virtual Data Office Computers
Financial Data Graph Over Cityscape with Digital Overlay
Digital Data Analysis over Cityscape Stock Market Concept
Dynamic Red Line Graph With Data Points on Gridded Background
Premium
Meeting of business executives discussing analysis of the company's financial situation and business planning with partner collaboration and consultation of strategy.
Dynamic Financial Data Overlay on Business Team Discussion
Diverse Colleagues Analyzing Growth Trends in Modern Office
Fluctuating Financial Graph on Green Grid Background
Dynamic Financial Data Displays Stock Market Trends
Digital Stock Market Graph Red Trendline on Green Background
Team Discussing Data with Graph Overlay in Modern Workspace
Red Declining Graph on Digital Grid Display Represents Falling Markets
Financial Data Visualization Over Futuristic Cityscape
Global Economic Trends Highlighted on World Map with Graphs
Digital Financial Data Visualization with Graph and Metrics
Financial Data Charts in Shimmering Blue Digital Space
Green Line Rising on Digital Trading Board with Abstract Background
Premium
Businessman draws  increase arrow graph corporate future growth year 2021 to 2022.   Development to success and motivation.
Diverse Team Analyzing Digital Financial Graphs in Modern Office
Diverse Coworkers Collaborating on Financial Growth Strategies
Business Team Analyzing Financial Data with Declining Market Trend
Analyzing Global Financial Trends and Data on Tablet in Modern Office
Team Collaborating on Business Analysis with Digital Data Overlay
Business Growth Concept with Graph Overlay
Data Processing Visualization with Code and Graphs
Dynamic Green Line Graph Showing Financial Data Fluctuations
Colleagues Analyzing Data with Graph Overlay in Office
Premium
chart trading - stock exchange - economy
Business Women Analyzing Data in Office with Growth Chart Overlay
Premium
Stock market chart, exchange financial growth diagram.Analysis finance grow graph and market investment. Financial business plan,earnings,sale and strategy.
Financial Graphs with Social Media Analytics on Digital Chart
City Skyline with Overlay of Financial Market Trends
Dynamic Financial Graphs and Data Analysis Interface
Dynamic Financial Data Graphs with Holographic Styles
Diverse Colleagues Analyzing Business Graphs for Growth Strategy
Diverse Team Analyzing Growth Data in Collaborative Office Meeting
Two Businesswomen Analyzing Growing Financial Trends in Office
Colleagues Analyzing Data Trends in Modern Office Environment
Business Team Analyzing Financial Graph on Laptop
Abstract Financial Data Processing and Analysis Interface
Financial Growth Stock Nikkei in Urban City Skyline
Doctor Analyzing Medical Data with Innovative Chart Overlay
Premium
Stock market analysis, business, finance and investment. Finance analyst analyzing stock market trading graph, economic growth chart, planning and strategy, business investment with financial report
Digital Financial Data Chart with Modern City Skyscrapers
Financial Data Analysis with Global Digital Interface
Premium
Finance trade manager analysing stock market indicators for best investment strategy, financial data and charts with business buildings in background
Digital Finance: Modern Stock Market Analysis Display
Premium
Businessman using laptop computer analyzing sales data and financial growth graph chart report. Business planning, strategy and development. Financial accounting. market research, data analysis
Business Team Analyzing Financial Downtrend Data in Modern Office
Business Colleagues Analyzing Graphs in Office Setting
Businesswoman Analyzing Financial Data with Graph Overlay Technology
Businessman Smiling with Graphs in Modern Office
Diverse Business Team Analyzing Financial Graph
Diverse Team Analyzing Business Market Trends with Technology
Caucasian Woman Leading Financial Data Analysis in Modern Office
Premium
Financial KPI Data Profits Dashboard On Computer
Dynamic Financial Growth Digital Chart Display
Green Financial Line Graph with Candlestick Data on Grid Background
Declining Graph Overlay on Night Traffic Scene Illustrates Downtrend
Dynamic Data Display Generating Business Growth Analysis
Dynamic Forex Trading Graphs with Increasing Numbers
Financial Analytics in Modern Office Environment
Rising Financial Data Graph on Digital Grid Background
Premium
Analysis finance grow graph and market investment. Financial business plan,earnings,sale and strategy. Stock market chart, exchange financial growth diagram.
Senior Manager Analyzing Financial Trends on Glass Wall
Financial Data Analysis Vibrant Graphs on Blue Background
Global Financial Data Analysis with Colorful Graphs
Dynamic Financial Data Overlaid on Grid Background
Premium
Stock exchange market traders investors working on financial trading charts analysis. Two happy busy business men analysts consulting on digital finance forecast using laptop in office. Copy space.
Business Professionals Analyzing Performance Data and Diagrams
Digital Financial Data Analysis on Grid Framework
Dynamic Stock Market Chart with Fluctuating Trends and Data Points
Senior Doctor Smiling with Overlay of Financial Graphs
Premium
Businessman presenting financial analysis with charts generated by big data displaying international success and dollar signs
Financial Data Displayed Over City Skyline with Rising Graphs
World Map with Falling Line Graphs Indicating Global Economic Decline
Financial Data Charts with World Map on Blue Digital Background
Dynamic Financial Growth Representing Business Trends
Fluctuating Digital Stock Market Data Chart
Financial Data Analysis in Modern Server Room Environment
Futuristic Graph and Data Visualization Interface Design
Businesswomen Collaborating with Data Analytics Overlay in Modern Office
Diverse Professionals Analyzing Business Data on Laptop in Office
Business Team Analyzing Financial Data for Growth Strategies
Colleagues Analyzing Data on Laptop with Overlayed Graph
Premium
Bearded man trader wearing eyeglasses sitting at desk at office monitoring stock market looking at monitors analyzing candle bar price flow touching chin concerned trading concept close-up
Diverse Team Analyzing Financial Data with Overlay Graph
Social Media Activity Icons on Digital Graph
Financial Market Growth Over City Skyline
Dynamic Financial Data Chart Display with Graphical Analysis
Digital Stock Market Green Graph Against Dark Trading Board
Premium
Investors use laptops to analyze stock market, investment strategies. and business growth analysis, investing in companies with long-term competitive advantages, against the backdrop of the city.
Financial Data Analysis with Team Collaboration in Office
Businesswomen Analyzing Financial Graphs for Growth Opportunities
Dynamic Data Chart on Dark Digital Background
Dynamic Stock Market Visual in Modern Office Setting
Premium
Asian businessman checking stock market data, Stock market application for iPad, Analyzing stock market data on desktop, Young businessman with stock market chart background
Premium
Businessman using pen touch candle chart financial growth of business and world economy. Stock market price increase. Stock market investment analysis, financial risk management and investment.
Business Colleagues Analyzing Financial Graph in Office Meeting
Colleagues Analyzing Stock Market Trends in Boardroom
Business Professionals Analyzing Stock Market Data on Laptop
Premium
Two people analyzing stock market investment strategy with key performance indicator on financial dashboard and business intelligence on computer
Premium
Financial chart and investment graph analysis stock on tablet screen. Data dashboard and report insight for finance growth, stock market, and business performance strategy.
Premium
Male trader sits at desk hold smart phone with stock market data, using laptop display graph and chart, analyzing investment, check trading stocks information, view over shoulder. Growth, profit, apps
Business Analysis With Line Graphs Overlay on Mobile Device Use
Explore More Free Stock Images