- Home >
- Stock Photos >
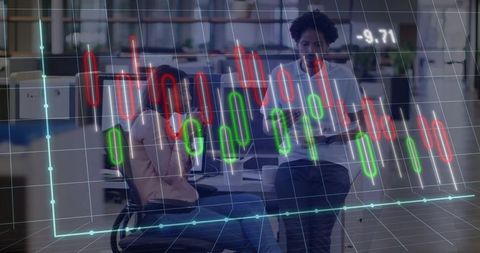
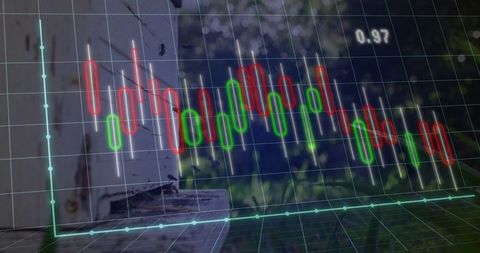
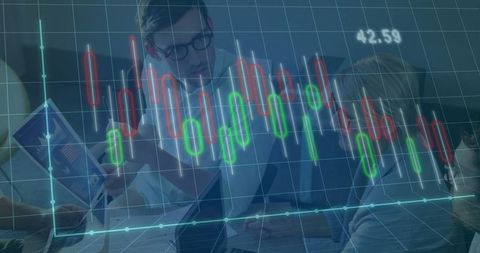
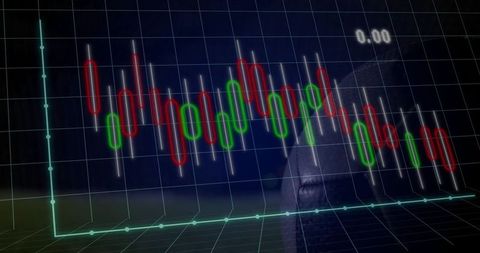
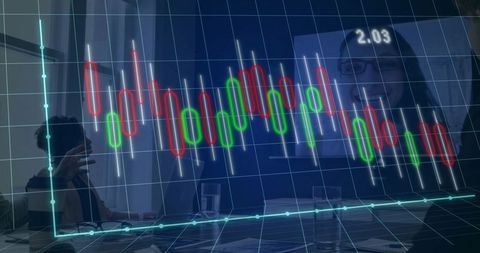
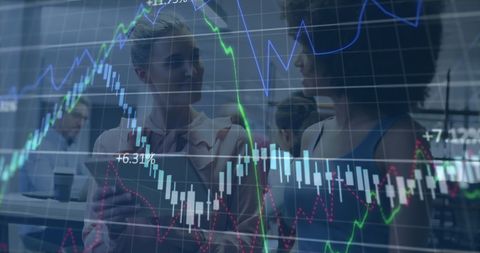
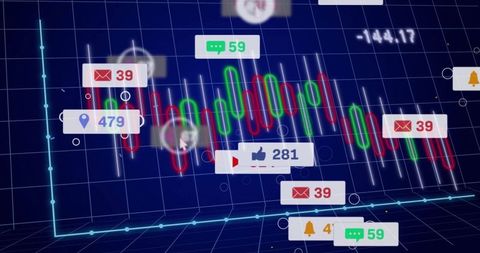
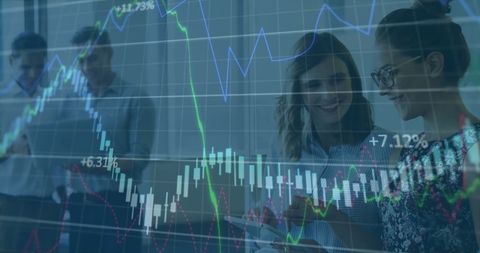
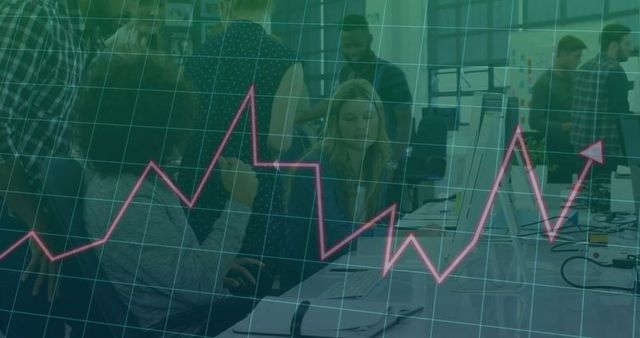
- Businessman Handling Finance with Digital Trading Chart Overlay
Businessman Handling Finance with Digital Trading Chart Overlay Image
Businessman organizing rolled coins with digital candlestick trading chart superimposed. Represents the intersection of traditional finance methods with modern data analysis. Suitable for illustrating financial articles, investment strategies, analytics, and fintech advancements.
Powered by  - Get 15% off with code: PIKWIZARD15


0
downloads
downloads
Tags:
More
Credit Photo
If you would like to credit the Photo, here are some ways you can do so
Text Link
photo Link
<span class="text-link">
<span>
<a target="_blank" href=https://pikwizard.com/photo/businessman-handling-finance-with-digital-trading-chart-overlay/37b21b476a8a3672dec1c8ae0800cf91/>PikWizard</a>
</span>
</span>
<span class="image-link">
<span
style="margin: 0 0 20px 0; display: inline-block; vertical-align: middle; width: 100%;"
>
<a
target="_blank"
href="https://pikwizard.com/photo/businessman-handling-finance-with-digital-trading-chart-overlay/37b21b476a8a3672dec1c8ae0800cf91/"
style="text-decoration: none; font-size: 10px; margin: 0;"
>
<img src="https://pikwizard.com/pw/medium/37b21b476a8a3672dec1c8ae0800cf91.jpg" style="margin: 0; width: 100%;" alt="" />
<p style="font-size: 12px; margin: 0;">PikWizard</p>
</a>
</span>
</span>
Free (free of charge)
Free for personal and commercial use.
Author: People Creations
Similar Free Stock Images
Loading...

Premium


Premium


Premium

Premium


Premium


Premium


Premium

Premium


Premium


Premium


Premium


Premium


Premium

Premium

Premium


Premium


Premium


Premium


Premium

Premium


Premium


Premium


Premium


Premium

Premium