
- Home >
- Stock Photos >
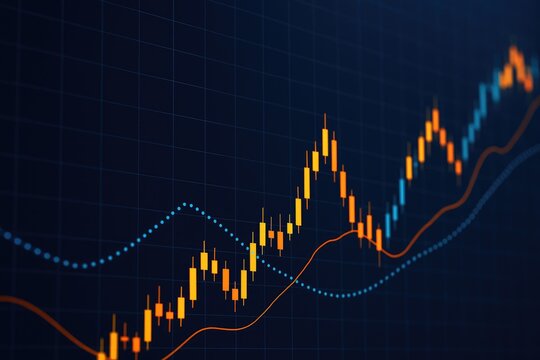
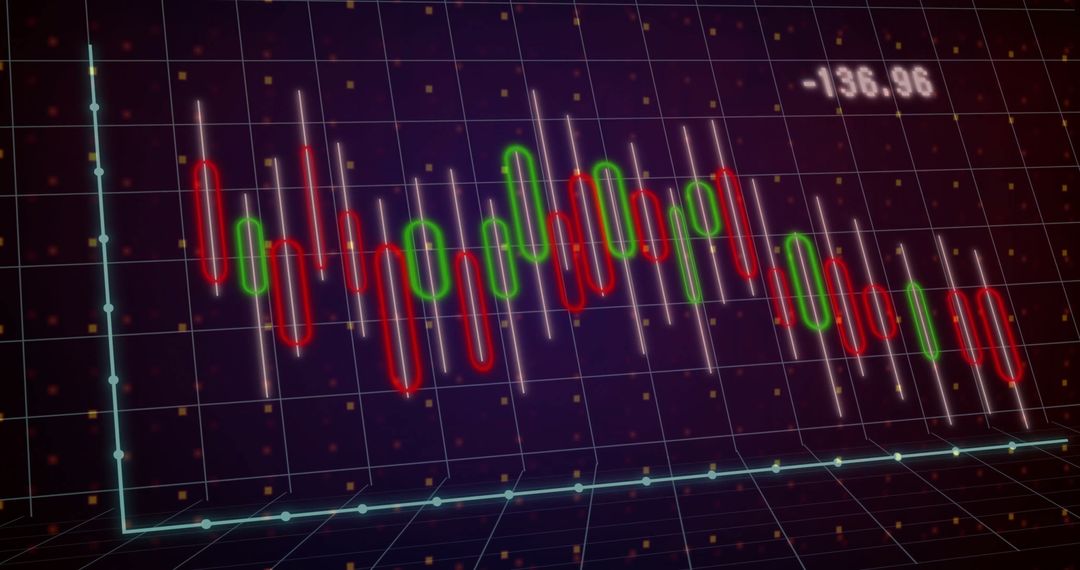
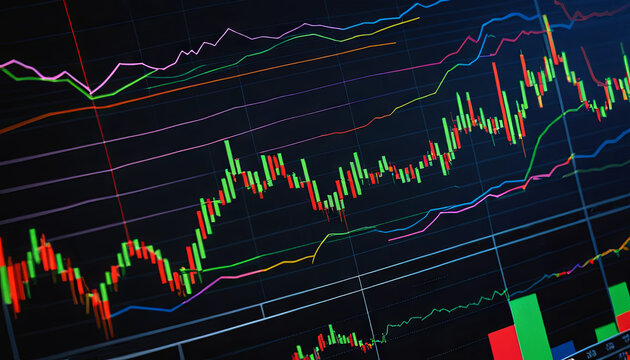
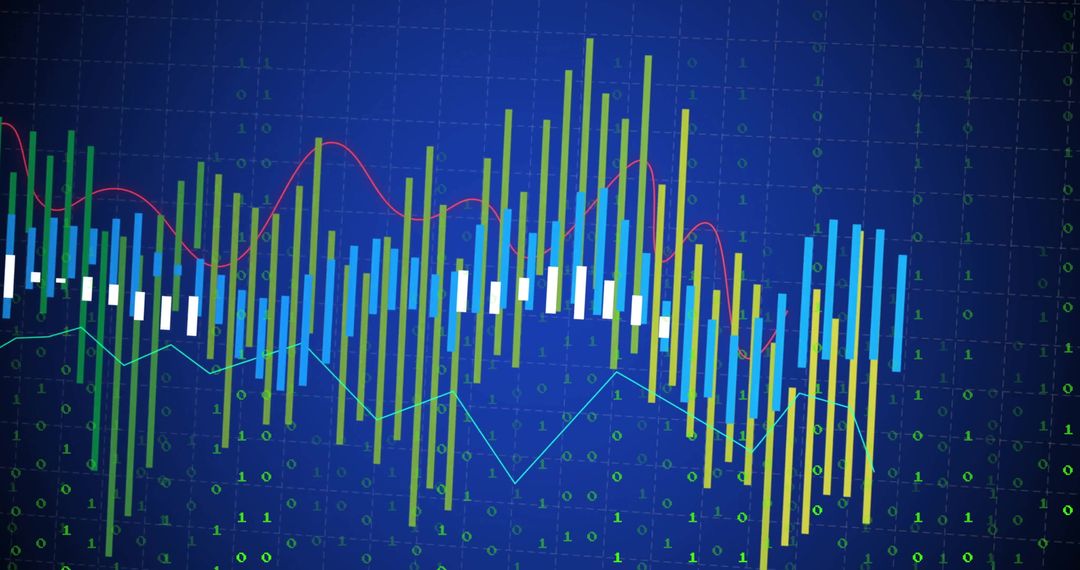
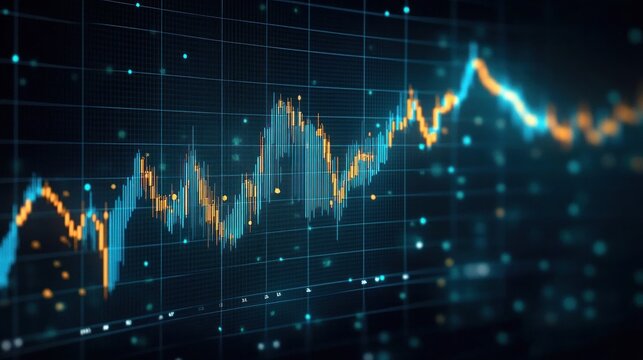
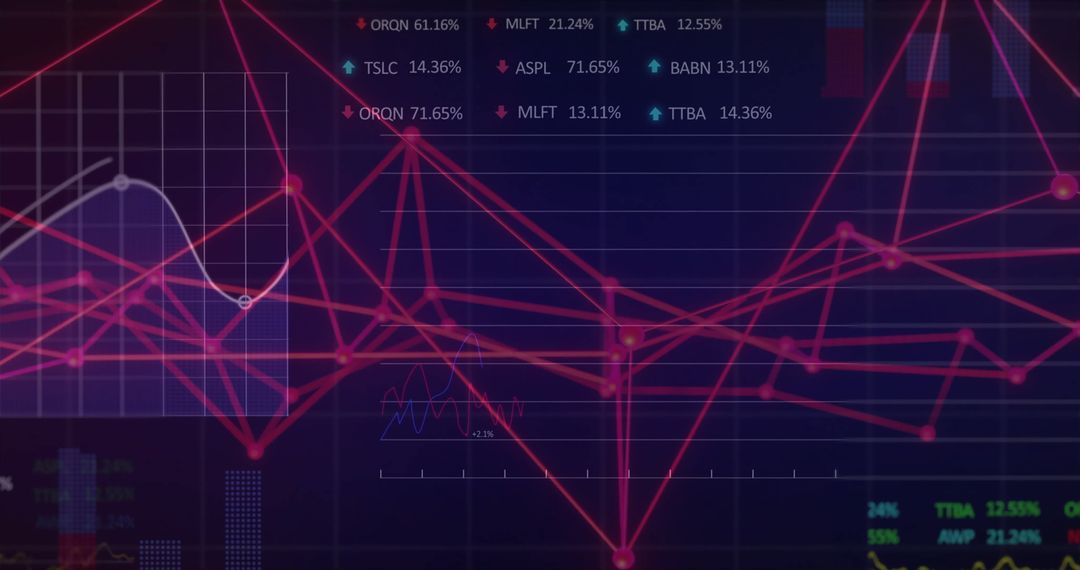
- Candlestick Chart Illustrating Financial Trends and Analytics
Candlestick Chart Illustrating Financial Trends and Analytics Image

Colorful candlestick chart showing financial movement over time appears against a dark interface with grid lines. Suitable for illustrating concepts in analytics, business intelligence, stock market trends, or technological advancements in finance. Can also be used on platforms discussing innovative financial tools or strategies.
Powered by 


0
downloads
downloads
Tags:
More
Credit Photo
If you would like to credit the Photo, here are some ways you can do so
Text Link
photo Link
<span class="text-link">
<span>
<a target="_blank" href=https://pikwizard.com/photo/candlestick-chart-illustrating-financial-trends-and-analytics/f8265309ef7da1e319ac193737e60a1d/>PikWizard</a>
</span>
</span>
<span class="image-link">
<span
style="margin: 0 0 20px 0; display: inline-block; vertical-align: middle; width: 100%;"
>
<a
target="_blank"
href="https://pikwizard.com/photo/candlestick-chart-illustrating-financial-trends-and-analytics/f8265309ef7da1e319ac193737e60a1d/"
style="text-decoration: none; font-size: 10px; margin: 0;"
>
<img src="https://pikwizard.com/pw/medium/f8265309ef7da1e319ac193737e60a1d.jpg" style="margin: 0; width: 100%;" alt="" />
<p style="font-size: 12px; margin: 0;">PikWizard</p>
</a>
</span>
</span>
Free (free of charge)
Free for personal and commercial use.
Author: People Creations
Similar Free Stock Images

Premium


Premium


Premium


Premium


Premium


Premium


Premium


Premium


Premium


Premium


Premium


Premium


Premium


Premium


Premium


Premium


Premium


Premium


Premium


Premium


Premium


Premium


Premium


Premium

