- Home >
- Stock Photos >
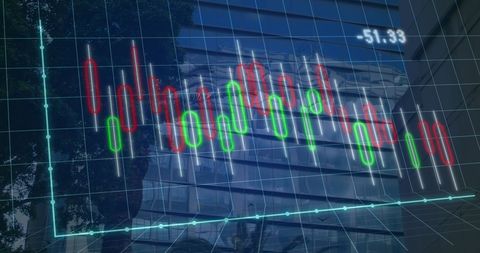
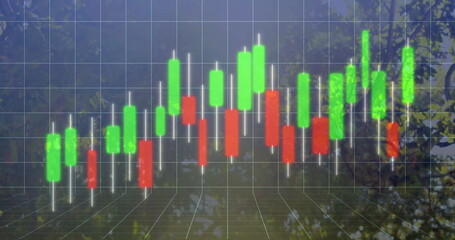
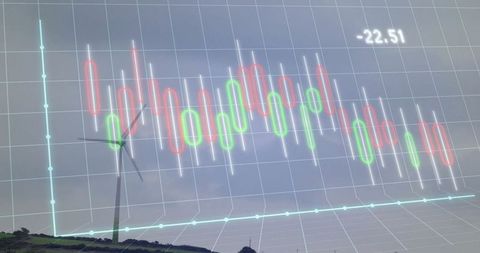
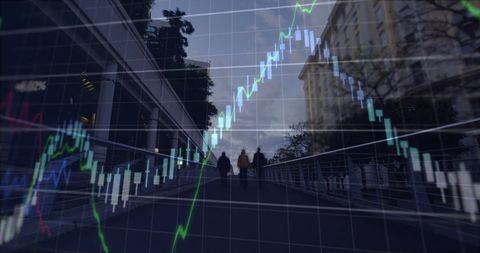
- Candlestick Chart Overlay in Natural Outdoor Setting
Candlestick Chart Overlay in Natural Outdoor Setting Image
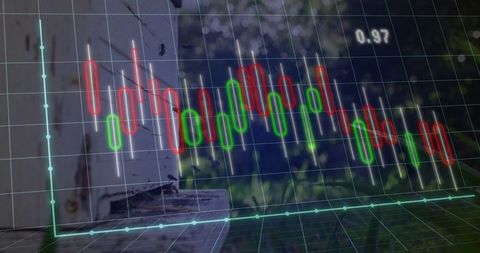
A candlestick chart is overlayed on a natural outdoor scene with plants and sunlight filtering through. The distinct green and red bars represent market movements, indicative of financial debate. The presence of caution potentially reflects connection between natural environments and economic indicators. Ideal for articles, blogs, or presentations related to finance, investments, or economy while also appealing aesthetically with natural elements.
Powered by 


0
downloads
downloads
Tags:
More
Credit Photo
If you would like to credit the Photo, here are some ways you can do so
Text Link
photo Link
<span class="text-link">
<span>
<a target="_blank" href=https://pikwizard.com/photo/candlestick-chart-overlay-in-natural-outdoor-setting/95d669acf4dbf747330d63c1b7e1809c/>PikWizard</a>
</span>
</span>
<span class="image-link">
<span
style="margin: 0 0 20px 0; display: inline-block; vertical-align: middle; width: 100%;"
>
<a
target="_blank"
href="https://pikwizard.com/photo/candlestick-chart-overlay-in-natural-outdoor-setting/95d669acf4dbf747330d63c1b7e1809c/"
style="text-decoration: none; font-size: 10px; margin: 0;"
>
<img src="https://pikwizard.com/pw/medium/95d669acf4dbf747330d63c1b7e1809c.jpg" style="margin: 0; width: 100%;" alt="" />
<p style="font-size: 12px; margin: 0;">PikWizard</p>
</a>
</span>
</span>
Free (free of charge)
Free for personal and commercial use.
Author: Authentic Images
Similar Free Stock Images
Loading...

Premium


Premium

Premium

Premium


Premium


Premium


Premium

Premium


Premium


Premium


Premium

Premium

Premium


Premium


Premium

Premium


Premium

Premium


Premium


Premium


Premium


Premium

Premium

Premium

Premium