
- Home >
- Stock Photos >
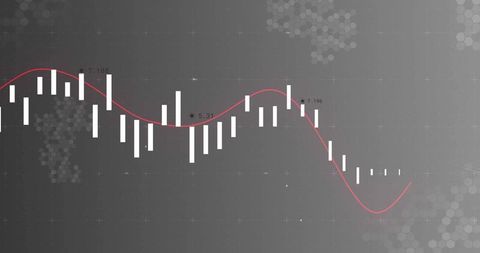
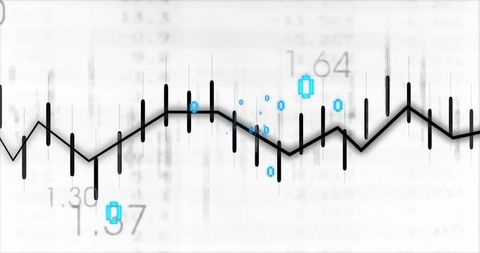
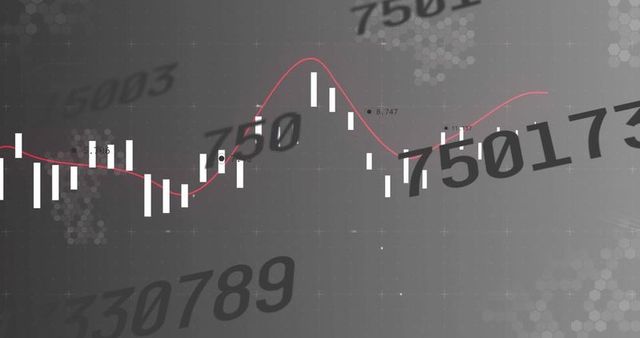
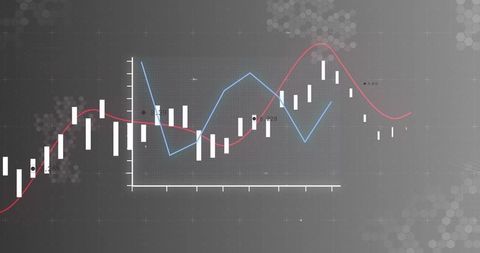
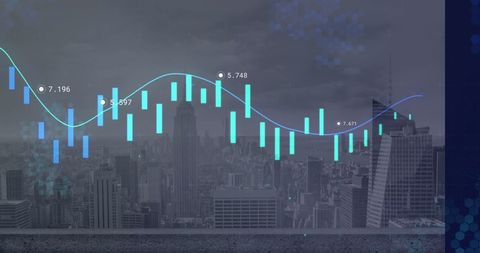
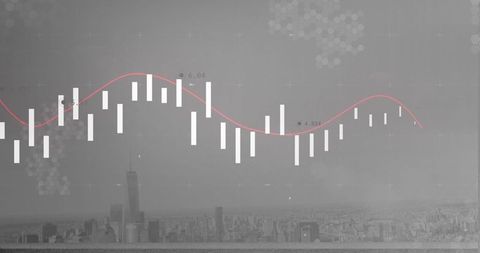
- Candlestick Chart with Moving Average for Data Analytics
Candlestick Chart with Moving Average for Data Analytics Image
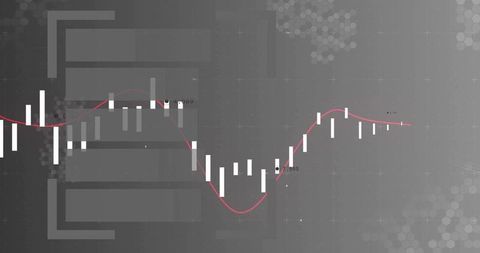
Visual representation of financial data using a candlestick chart with a red moving average line is useful for illustrating trends in stock prices on trading platforms. Ideal for use in fintech-related presentations, finance company blogs, or educational materials on investment strategies.
Powered by 


downloads
Tags:
More
Credit Photo
If you would like to credit the Photo, here are some ways you can do so
Text Link
photo Link
<span class="text-link">
<span>
<a target="_blank" href=https://pikwizard.com/photo/candlestick-chart-with-moving-average-for-data-analytics/8cdd04e2624dbb4672248f4ba777164d/>PikWizard</a>
</span>
</span>
<span class="image-link">
<span
style="margin: 0 0 20px 0; display: inline-block; vertical-align: middle; width: 100%;"
>
<a
target="_blank"
href="https://pikwizard.com/photo/candlestick-chart-with-moving-average-for-data-analytics/8cdd04e2624dbb4672248f4ba777164d/"
style="text-decoration: none; font-size: 10px; margin: 0;"
>
<img src="https://pikwizard.com/pw/medium/8cdd04e2624dbb4672248f4ba777164d.jpg" style="margin: 0; width: 100%;" alt="" />
<p style="font-size: 12px; margin: 0;">PikWizard</p>
</a>
</span>
</span>
Free (free of charge)
Free for personal and commercial use.
Author: Creative Art
Similar Free Stock Images
Premium


Premium
Premium


Premium


Premium


Premium


Premium


Premium


Premium


Premium


Premium


Premium


Premium


Premium


Premium


Premium


Premium


Premium


Premium

Premium


Premium


Premium


Premium


Premium


Premium

Explore More Free Stock Images