
- Home >
- Stock Photos >
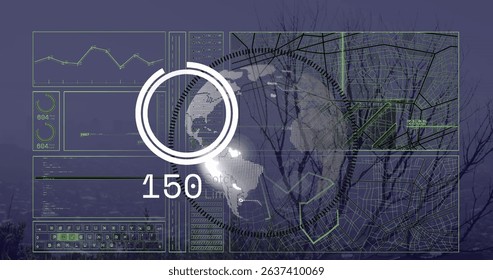
- Colorful Data Streams in Digital Interface
Colorful Data Streams in Digital Interface Image

Dynamic illustration depicts colorful lines and bar graphs against dark background. Highlights concept of digital data processing and analytics in context of global business and finance. Ideal for projects related to technology advancements, financial tech solutions, and visualization of data connections. Useful in illustrative articles or presentations focused on innovative technology, projected business growth, or energy sustainability trends.
Powered by  - Get 15% off with code: PIKWIZARD15


downloads
Tags:
More
Credit Photo
If you would like to credit the Photo, here are some ways you can do so
Text Link
photo Link
<span class="text-link">
<span>
<a target="_blank" href=https://pikwizard.com/photo/colorful-data-streams-in-digital-interface/2e739289d869e13a325ff44a259193e2/>PikWizard</a>
</span>
</span>
<span class="image-link">
<span
style="margin: 0 0 20px 0; display: inline-block; vertical-align: middle; width: 100%;"
>
<a
target="_blank"
href="https://pikwizard.com/photo/colorful-data-streams-in-digital-interface/2e739289d869e13a325ff44a259193e2/"
style="text-decoration: none; font-size: 10px; margin: 0;"
>
<img src="https://pikwizard.com/pw/medium/2e739289d869e13a325ff44a259193e2.jpg" style="margin: 0; width: 100%;" alt="" />
<p style="font-size: 12px; margin: 0;">PikWizard</p>
</a>
</span>
</span>
Free (free of charge)
Free for personal and commercial use.
Author: People Creations
Similar Free Stock Images

Premium


Premium

Premium


Premium


Premium


Premium


Premium


Premium

Premium

Premium

Premium


Premium


Premium


Premium


Premium


Premium


Premium


Premium


Premium


Premium


Premium

Premium


Premium


Premium


Premium


Explore More Free Stock Images