
- Home >
- Stock Photos >
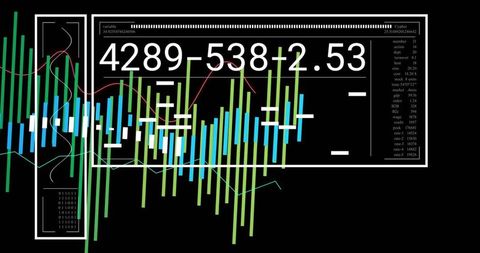
- Colorful Data Visualization and Analytics Interface on Dark Grid
Colorful Data Visualization and Analytics Interface on Dark Grid Image

Vibrant vertical bars and wavy line graphs stand out against a dark grid backdrop, resembling a sophisticated analytics interface. Dynamic geometric icons seamlessly blend with data patterns, symbolizing the complexity of modern data management and technology processes. Perfect for illustrating concepts related to analytics, data visualization, advanced dashboards, infographics, technological advancements, finance, business reports, and software engineering within presentations, articles, and educational content.
Powered by 


downloads
Tags:
More
Credit Photo
If you would like to credit the Photo, here are some ways you can do so
Text Link
photo Link
<span class="text-link">
<span>
<a target="_blank" href=https://pikwizard.com/photo/colorful-data-visualization-and-analytics-interface-on-dark-grid/446e1a717bc8ec13b2323e5a848e4d93/>PikWizard</a>
</span>
</span>
<span class="image-link">
<span
style="margin: 0 0 20px 0; display: inline-block; vertical-align: middle; width: 100%;"
>
<a
target="_blank"
href="https://pikwizard.com/photo/colorful-data-visualization-and-analytics-interface-on-dark-grid/446e1a717bc8ec13b2323e5a848e4d93/"
style="text-decoration: none; font-size: 10px; margin: 0;"
>
<img src="https://pikwizard.com/pw/medium/446e1a717bc8ec13b2323e5a848e4d93.jpg" style="margin: 0; width: 100%;" alt="" />
<p style="font-size: 12px; margin: 0;">PikWizard</p>
</a>
</span>
</span>
Free (free of charge)
Free for personal and commercial use.
Author: Authentic Images
Similar Free Stock Images

Premium


Premium


Premium


Premium


Premium


Premium


Premium

Premium


Premium


Premium


Premium


Premium

Premium


Premium


Premium


Premium


Premium


Premium

Premium


Premium


Premium

Premium


Premium


Premium


Premium

Explore More Free Stock Images