
- Home >
- Free Stock Photos & Images >
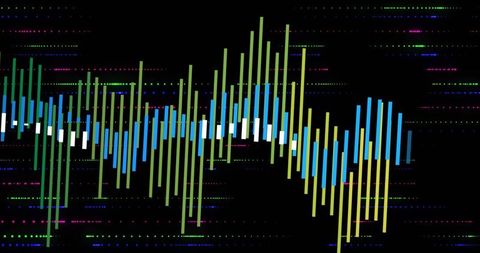
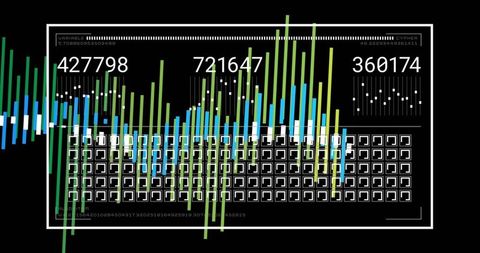
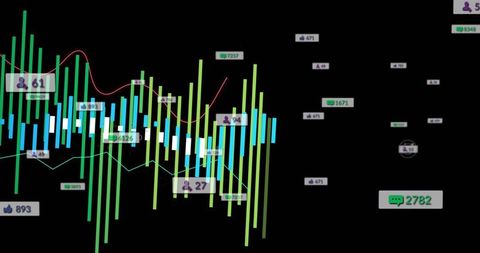
- Binary Code Financial Data Visualization
Binary Code Financial Data Visualization Free Stock Image
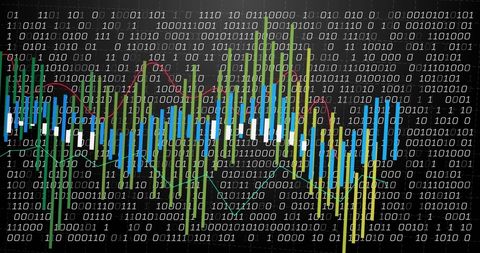
Binary and numerical data merges through colorful bar and line graphs on a dark background, illustrating the concept of digital financial analytics and processing. Useful for business presentations or articles on data science, finance technology, and computing advancements, this graphic highlights complex interactions within digital finance and can engage those interested in tech-driven business strategies.
Powered by  - Get 15% off with code: PIKWIZARD15


downloads
Tags:
More
Credit Photo
If you would like to credit the Photo, here are some ways you can do so
Text Link
photo Link
<span class="text-link">
<span>
<a target="_blank" href=https://pikwizard.com/photo/binary-code-financial-data-visualization/ccd58e9b97181e0e1370e9c648952984/>PikWizard</a>
</span>
</span>
<span class="image-link">
<span
style="margin: 0 0 20px 0; display: inline-block; vertical-align: middle; width: 100%;"
>
<a
target="_blank"
href="https://pikwizard.com/photo/binary-code-financial-data-visualization/ccd58e9b97181e0e1370e9c648952984/"
style="text-decoration: none; font-size: 10px; margin: 0;"
>
<img src="https://thumbs.wbm.im/pw/medium/ccd58e9b97181e0e1370e9c648952984.jpg" style="margin: 0; width: 100%;" alt="Binary Code Financial Data Visualization" />
<p style="font-size: 12px; margin: 0;">PikWizard</p>
</a>
</span>
</span>
Free (free of charge)
Free for personal and commercial use.
Author: Authentic Images
Similar Free Stock Images


Premium


Premium


Premium


Premium


Premium


Premium


Premium


Premium


Premium


Premium


Premium


Premium


Premium


Premium


Premium


Premium


Premium


Premium


Premium


Premium


Premium


Premium


Premium


Premium


Premium

Explore More Free Stock Images