
- Home >
- Free Stock Photos & Images >
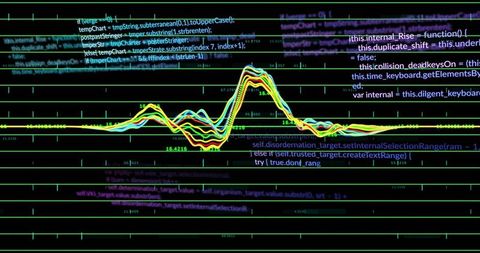
- Displaying 3D color-coded bars with floating monospaced code and neon data lines
Displaying 3D color-coded bars with floating monospaced code and neon data lines Free Stock Image

Showing 3D color-coded candlestick bars layered over monospaced programming code with neon line plots on dark background. Featuring vibrant teal, green, purple highlights and holographic depth for dynamic tech mood. Suiting fintech landing pages, trading platform interfaces, analytics dashboard mockups, cybersecurity presentations, and editorial content about data science or market analysis. Providing strong focal point for headline or logo placement with negative space on right. Recommending overlaying white or cyan text for high contrast and cropping tight for hero banner or wide for website header. Supporting use in social media posts, slide decks, marketing materials, and product demos to convey advanced analytics, algorithmic trading, or developer-focused narratives.
Powered by  - Get 15% off with code: PIKWIZARD15


downloads
Tags:
More
Credit Photo
If you would like to credit the Photo, here are some ways you can do so
Text Link
photo Link
<span class="text-link">
<span>
<a target="_blank" href=https://pikwizard.com/photo/displaying-3d-color-coded-bars-with-floating-monospaced-code-and-neon-data-lines/600863c2c96e8de69d08105e5c4e6afd/>PikWizard</a>
</span>
</span>
<span class="image-link">
<span
style="margin: 0 0 20px 0; display: inline-block; vertical-align: middle; width: 100%;"
>
<a
target="_blank"
href="https://pikwizard.com/photo/displaying-3d-color-coded-bars-with-floating-monospaced-code-and-neon-data-lines/600863c2c96e8de69d08105e5c4e6afd/"
style="text-decoration: none; font-size: 10px; margin: 0;"
>
<img src="https://thumbs.wbm.im/pw/medium/600863c2c96e8de69d08105e5c4e6afd.jpg" style="margin: 0; width: 100%;" alt="Displaying 3D color-coded bars with floating monospaced code and neon data lines" />
<p style="font-size: 12px; margin: 0;">PikWizard</p>
</a>
</span>
</span>
Free (free of charge)
Free for personal and commercial use.
Author: Authentic Images
Similar Free Stock Images


Premium


Premium


Premium


Premium


Premium


Premium


Premium


Premium


Premium


Premium


Premium


Premium


Premium


Premium


Premium


Premium


Premium


Premium


Premium


Premium


Premium


Premium


Premium


Premium


Premium

Explore More Free Stock Images