
- Home >
- Stock Photos >
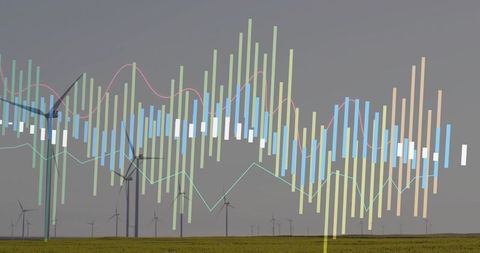
- Colorful Data Visualization with Technological Icon Elements
Colorful Data Visualization with Technological Icon Elements Image

Dynamic visualization of digital data featuring vibrant colored lines and abstract icons personifying interaction and connectivity motifs for business and technological concepts. Leveraging icons including notifications and communication, this illustration perfectly suits presentations, infographics, business proposals, and digital analytics services representation.
Powered by 


downloads
Tags:
More
Credit Photo
If you would like to credit the Photo, here are some ways you can do so
Text Link
photo Link
<span class="text-link">
<span>
<a target="_blank" href=https://pikwizard.com/photo/colorful-data-visualization-with-technological-icon-elements/658b1858158ec7a6b81baab00950b064/>PikWizard</a>
</span>
</span>
<span class="image-link">
<span
style="margin: 0 0 20px 0; display: inline-block; vertical-align: middle; width: 100%;"
>
<a
target="_blank"
href="https://pikwizard.com/photo/colorful-data-visualization-with-technological-icon-elements/658b1858158ec7a6b81baab00950b064/"
style="text-decoration: none; font-size: 10px; margin: 0;"
>
<img src="https://pikwizard.com/pw/medium/658b1858158ec7a6b81baab00950b064.jpg" style="margin: 0; width: 100%;" alt="" />
<p style="font-size: 12px; margin: 0;">PikWizard</p>
</a>
</span>
</span>
Free (free of charge)
Free for personal and commercial use.
Author: Authentic Images
Similar Free Stock Images

Premium


Premium


Premium

Premium


Premium


Premium


Premium


Premium

Premium


Premium


Premium


Premium


Premium


Premium

Premium


Premium

Premium


Premium


Premium


Premium


Premium

Premium


Premium


Premium


Premium


Explore More Free Stock Images