
- Home >
- Stock Photos >
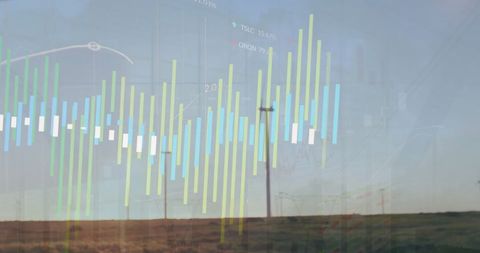
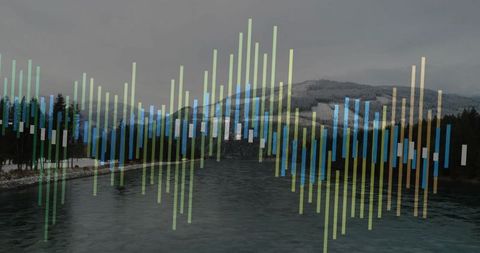
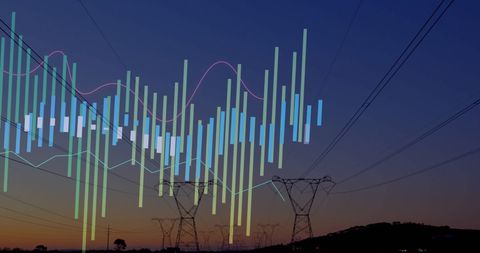
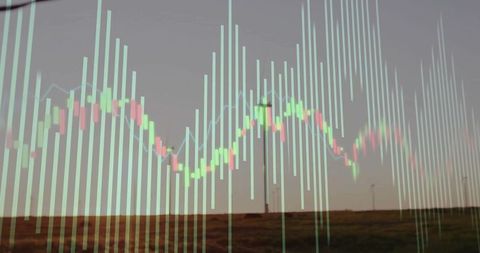
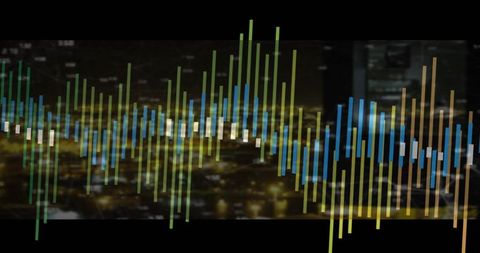
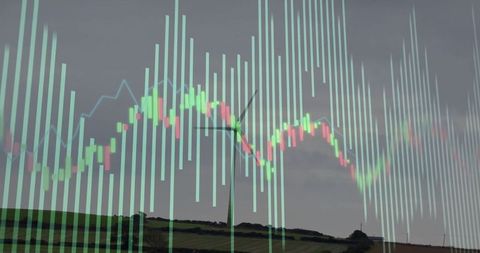
- Colorful Digital Waveform Chart Analytics
Colorful Digital Waveform Chart Analytics Image

Vibrant multicolored waveforms over a blue background representing data processing and digital analytics. This illustration is ideal for conveying themes of financial analysis, global business strategies, or technological developments. Useful in digital marketing materials, business presentations, and content focused on innovation and technology.
Powered by 


downloads
Tags:
More
Credit Photo
If you would like to credit the Photo, here are some ways you can do so
Text Link
photo Link
<span class="text-link">
<span>
<a target="_blank" href=https://pikwizard.com/photo/colorful-digital-waveform-chart-analytics/49eab2c16125f3d8b32b32213bc30a28/>PikWizard</a>
</span>
</span>
<span class="image-link">
<span
style="margin: 0 0 20px 0; display: inline-block; vertical-align: middle; width: 100%;"
>
<a
target="_blank"
href="https://pikwizard.com/photo/colorful-digital-waveform-chart-analytics/49eab2c16125f3d8b32b32213bc30a28/"
style="text-decoration: none; font-size: 10px; margin: 0;"
>
<img src="https://pikwizard.com/pw/medium/49eab2c16125f3d8b32b32213bc30a28.jpg" style="margin: 0; width: 100%;" alt="" />
<p style="font-size: 12px; margin: 0;">PikWizard</p>
</a>
</span>
</span>
Free (free of charge)
Free for personal and commercial use.
Author: Awesome Content
Similar Free Stock Images

Premium


Premium

Premium


Premium


Premium


Premium


Premium


Premium

Premium


Premium


Premium


Premium

Premium

Premium

Premium


Premium


Premium


Premium


Premium


AI


Premium


Premium


Premium


Premium


Premium


Premium

Explore More Free Stock Images